
|
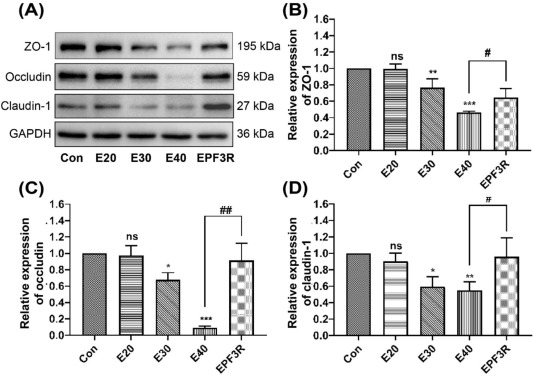
Fig. 9 Effect of EPF3 on the expression of tight junction-related protein in Caco-2 cells was analyzed by Western blot. (A) Representative blots of ZO-1, occludin, and claudin-1. The quantification of the protein expression levels of ZO-1 (B), occludin (C), and claudin-1 (D). Data were presented as mean ± standard deviation (n = 3). nsP > 0.05, *P < 0.05, **P < 0.01, and ***P < 0.001, vs the Con group. #P < 0.05 and ##P < 0.01, vs the E40 group. Con: control group treated without EPF3; E20: group treated with 20 μg/mL EPF3; E30: group treated with 30 μg/mL EPF3; E40: group treated with 40 μg/mL EPF3; EPF3: a fibrinolysin monomer isolated and purified from Pheretima vulgaris Chen; EPF3R: group treated with 40 μg/mL EPF3 for 12 h, followed by EPF3 removal and cultured in minimum essential medium for another 12 h; GAPDH: glyceraldehyde-3-phosphate dehydrogenase; ZO-1: zonula occludens-1.