
|
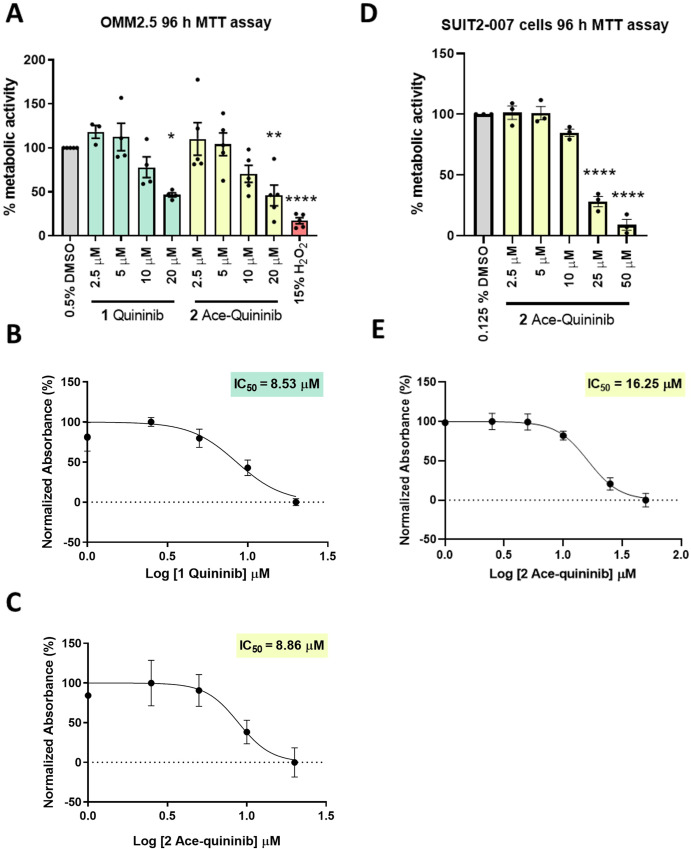
Fig. 5 Ace-quininib (2) significantly reduces viability of OMM2.5 and SUIT2-007 cells. (A) A dose-dependent, significant decrease in OMM2.5 cell metabolic activity was observed following 96 h treatment with quininib (1) or ace-quininib (2) in comparison to 0.5 % DMSO treatment. One-way ANOVA with Dunnett's Test for Multiple Comparisons statistical analysis was performed; error bars represent mean ± SEM, ∗p < 0.05, ∗∗p < 0.01, ∗∗∗∗p < 0.0001. (N = 3–5). (B,C) IC50 values of quininib (1) (B) and ace-quininib (2) (C) in OMM2.5 cells following a 96 h treatment, as determined by metabolic activity assays. (D) A dose-dependent, significant decrease in SUIT2-007 cell metabolic activity was observed following 96 h treatment with ace-quininib (2) in comparison to 0.125 % DMSO treatment. One-way ANOVA with Dunnett's Test for Multiple Comparisons statistical analysis was performed; error bars represent mean ± SEM, ∗∗∗∗p < 0.0001 (N = 3). (E) IC50 value of ace-quininib (2) in SUIT2-007 cells following a 96 h treatment, as determined by metabolic activity assays.