
|
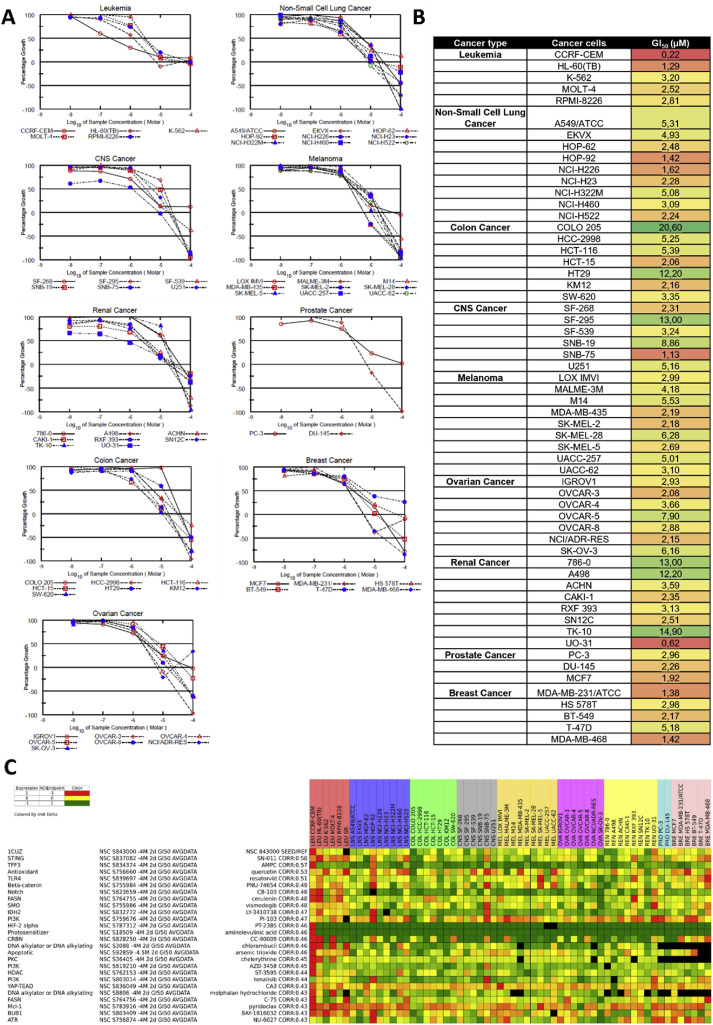
Fig. 4 The anti-cancer effects of ace-quininib (2) in the NCI-60 human tumor cell line screen. (A) Each panel represents cell lines derived from of a particular type of cancer (left to right, top to bottom): 5 leukemia cancer cell lines, 9 non-small cell lung cancer (NSCLC) cell lines, 6 central nervous system (CNS) cell lines, 9 melanoma cell lines, 8 renal cancer cell lines, 2 prostate cancer cell lines, 7 colon cancer cell lines, 6 breast cancer cell lines, and 7 ovarian cancer cell lines. Ace-quininib (2) was tested at the concentration range of 0.01, 0.1, 1, 10, 100 μM and cells were exposed for 48 h. (B) Five-dose GI50 trend analysis of ace-quininib (2) against the full panel of human tumour cell lines. Red = most responsive cell lines, green = least responsive cell line. Values are shown in μM. (C) Heat map view of hierarchical clustering of NCI-60 growth response Pearson correlation patterns, derived from the COMPARE algorithm. The heat map ranks the entire database of tested compounds, in the order of the similarity of the GI50 response of the cell lines to the compounds in the database, to the responses of the cell lines to ace-quininib (2) (NSC: S843000). NCI-60 data for the targeted investigational oncology agents (IOA) set of 180 clinically approved agents and 820 investigational agents were used to run the COMPARE analysis. NCIEndpoint is color representation of unitDelta GI50 values ranging from 10−9 M (red) to 10−5 M (green). Cells are black when values were not obtained.