
Image
|
Figure Caption
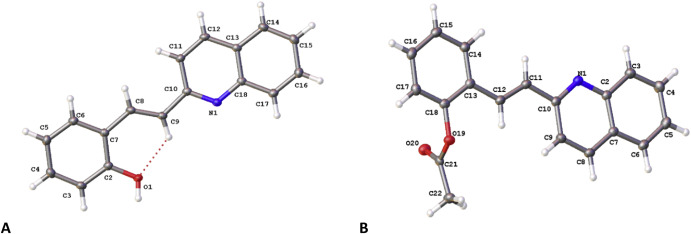
Fig. 2 Molecular structure of (A) quininib (1) and (B) ace-quininib (2) with displacement parameters shown at 50 % probability. Intramolecular hydrogen bonding represented by dotted line.
Acknowledgments
This image is the copyrighted work of the attributed author or publisher, and
ZFIN has permission only to display this image to its users.
Additional permissions should be obtained from the applicable author or publisher of the image.
Full text @ Eur. J. Med. Chem.