
|
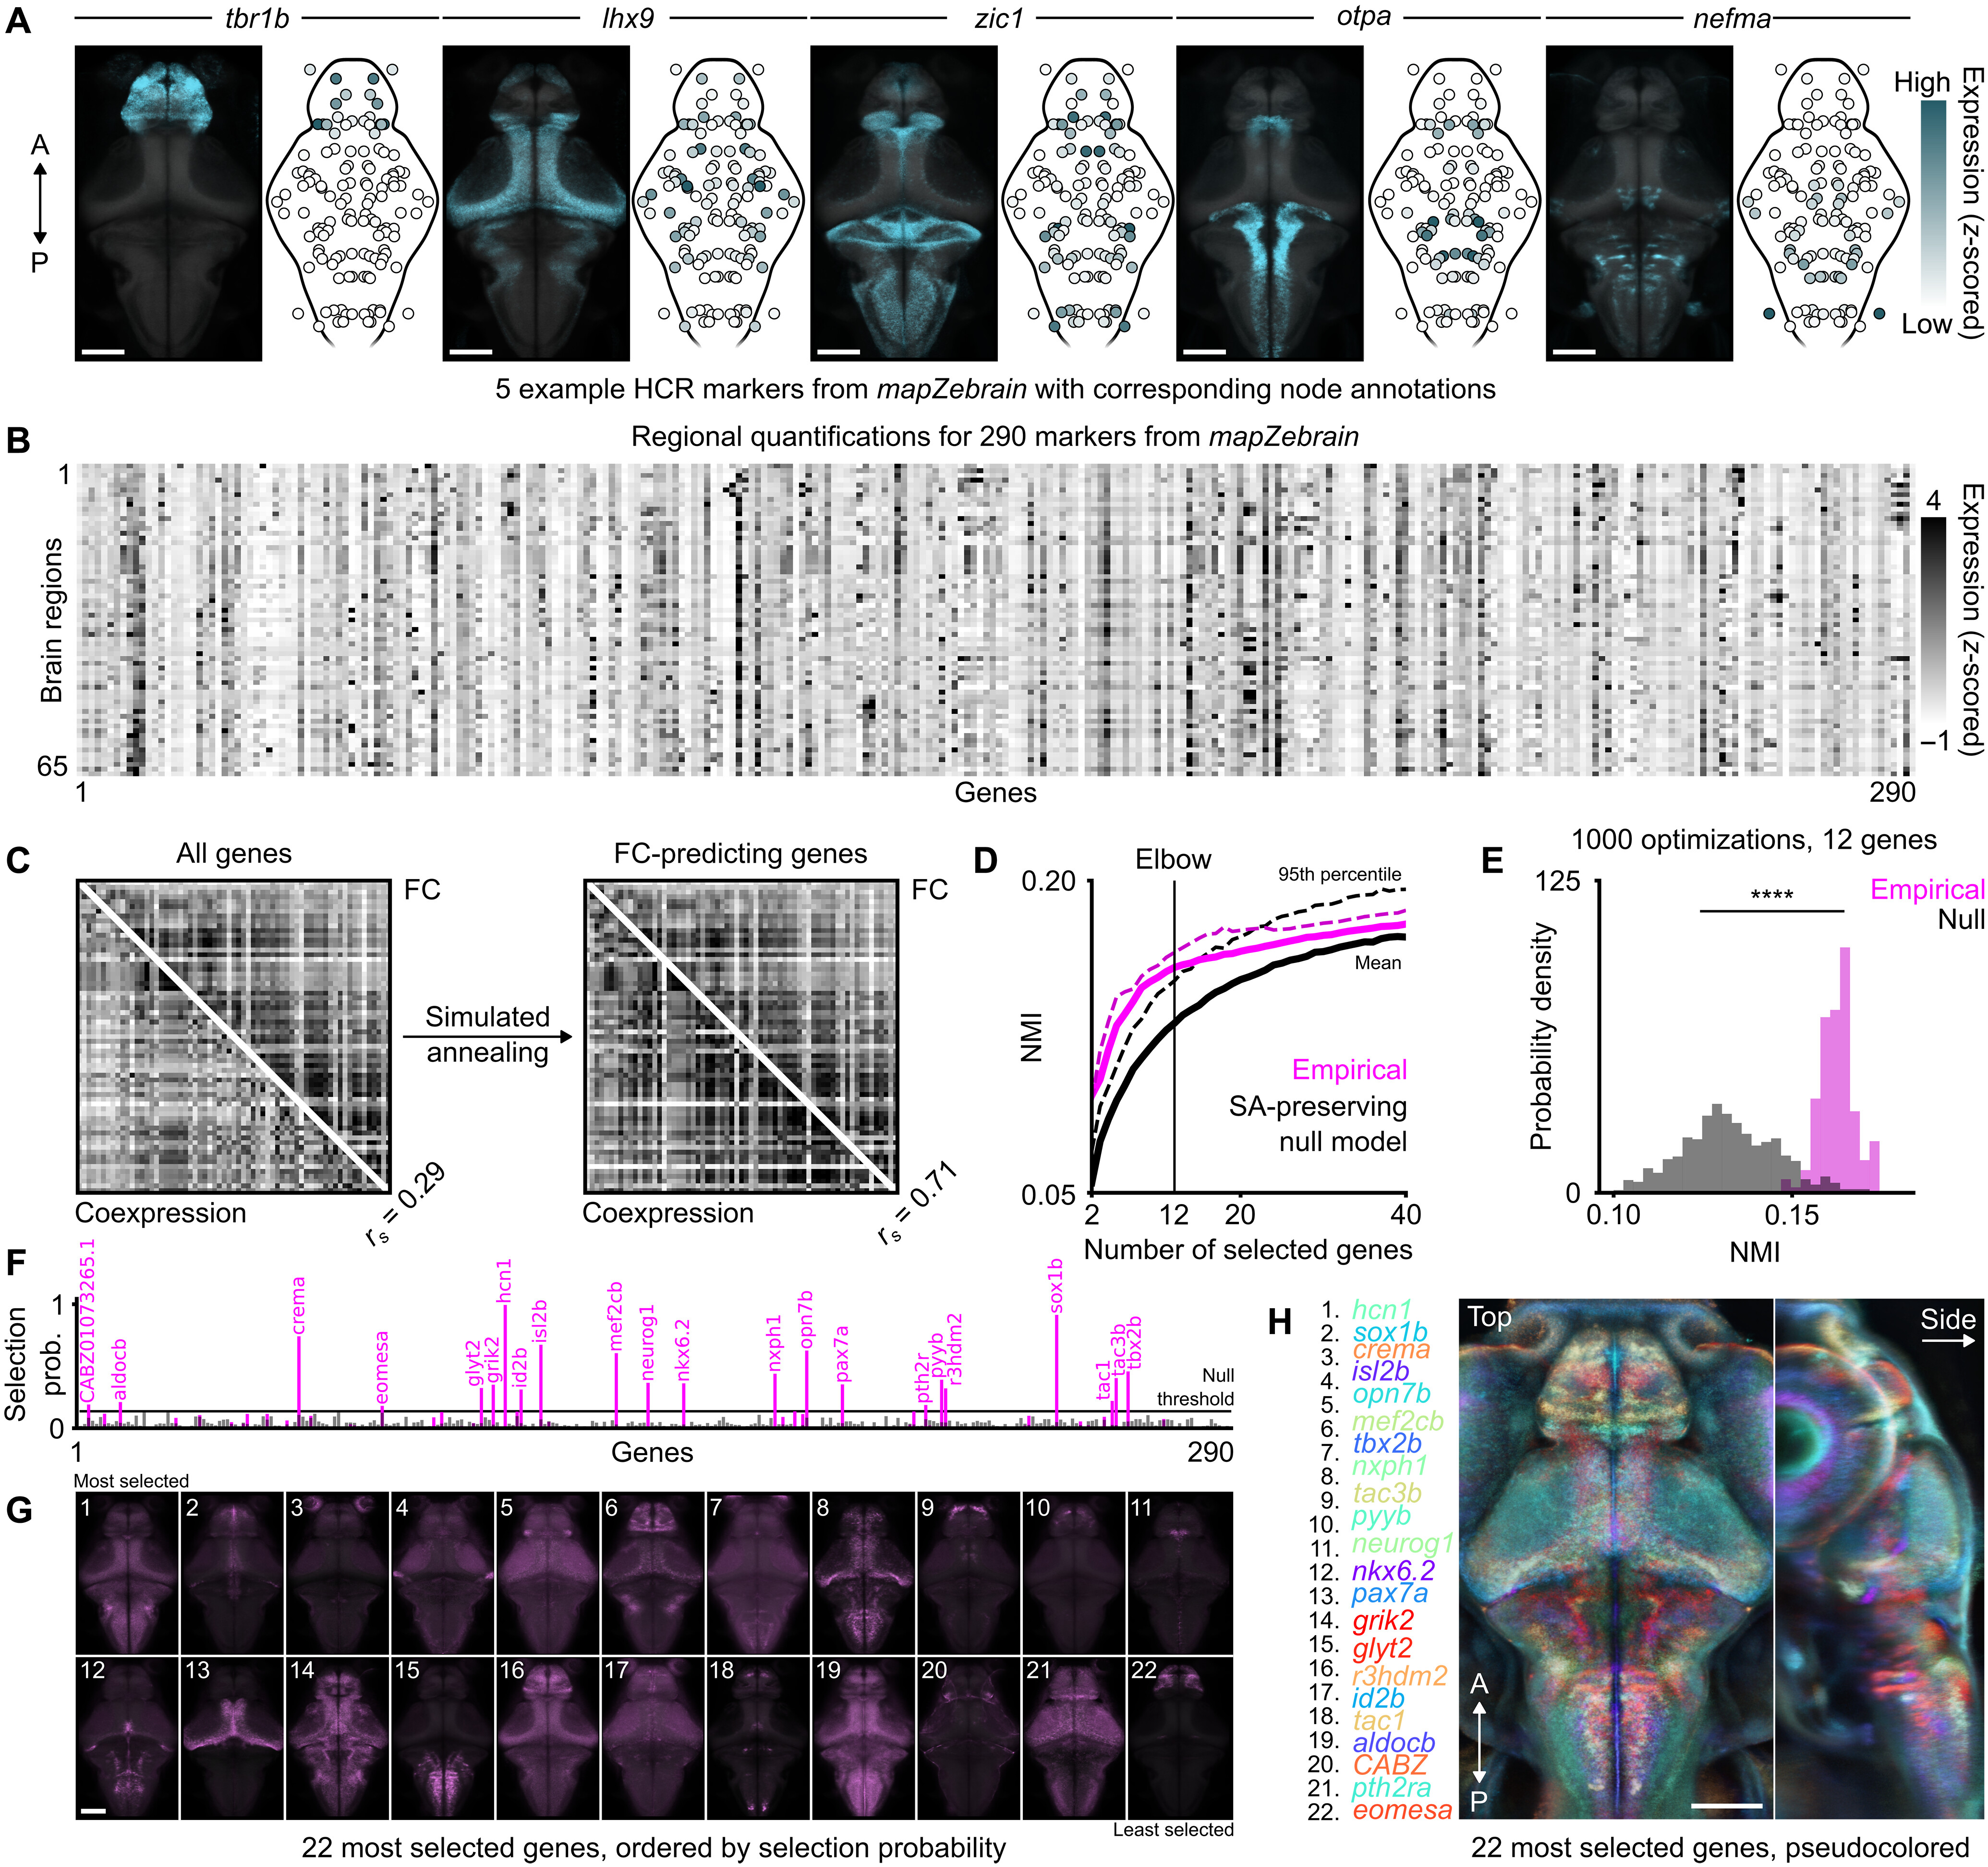
Fig. 7 Gene coexpression predicts FC. (A) Five example fluorescence in situ hybridization markers from mapZebrain (left: top view, 90th percentile projections), withcorresponding regional annotations (right: in black outlines); intensities are scaled arbitrarily per gene for visualization. (B) Regional gene expression matrix; each row(brain region) is z-scored independently. (C) Left: cGe matrix across all 290 genes, compared with the Fc matrix; r s denotes the Spearman coefficient. Right: cGe matrix of12 optimized genes obtained through simulated annealing, compared with Fc. (D) Average (full lines) and 95th percentile (dotted lines) of optimized nMi between cGeand Fc for varying numbers of genes used in simulated annealing runs; pink curves correspond to empirical gene sets, whereas black curves correspond to spatiallyshuffled genes; a vertical line indicates the elbow of the average empirical curve; 1000 optimization runs per number of genes. (E) nMi distributions at the predeterminedelbow point for empirical and null optimization results using 12 genes (P < 0.001, t test). (F) Selection frequency of each gene across 1000 simulated annealing runs; pinkbars correspond to empirical genes, whereas black bars correspond to spatially shuffled gene datasets; a horizontal bar denotes a selection threshold, with significantgene names indicated above. (G) 90th percentile intensity projections of 22 significant gene markers; gene names are indicated in the next panel, ordered by selectionprobability (left to right, top to bottom). (H) Overlap of 22 pseudocolored gene markers; pixelwise color contrast is used to highlight the most prominent genes at eachlocation; colors are used to accentuate the global patterns, rather than to precisely distinguish individual genes (which are displayed separately in the previous panel).A, anterior; P, posterior; SA, spatial autocorrelation. Scale bars, 100 μm.