
|
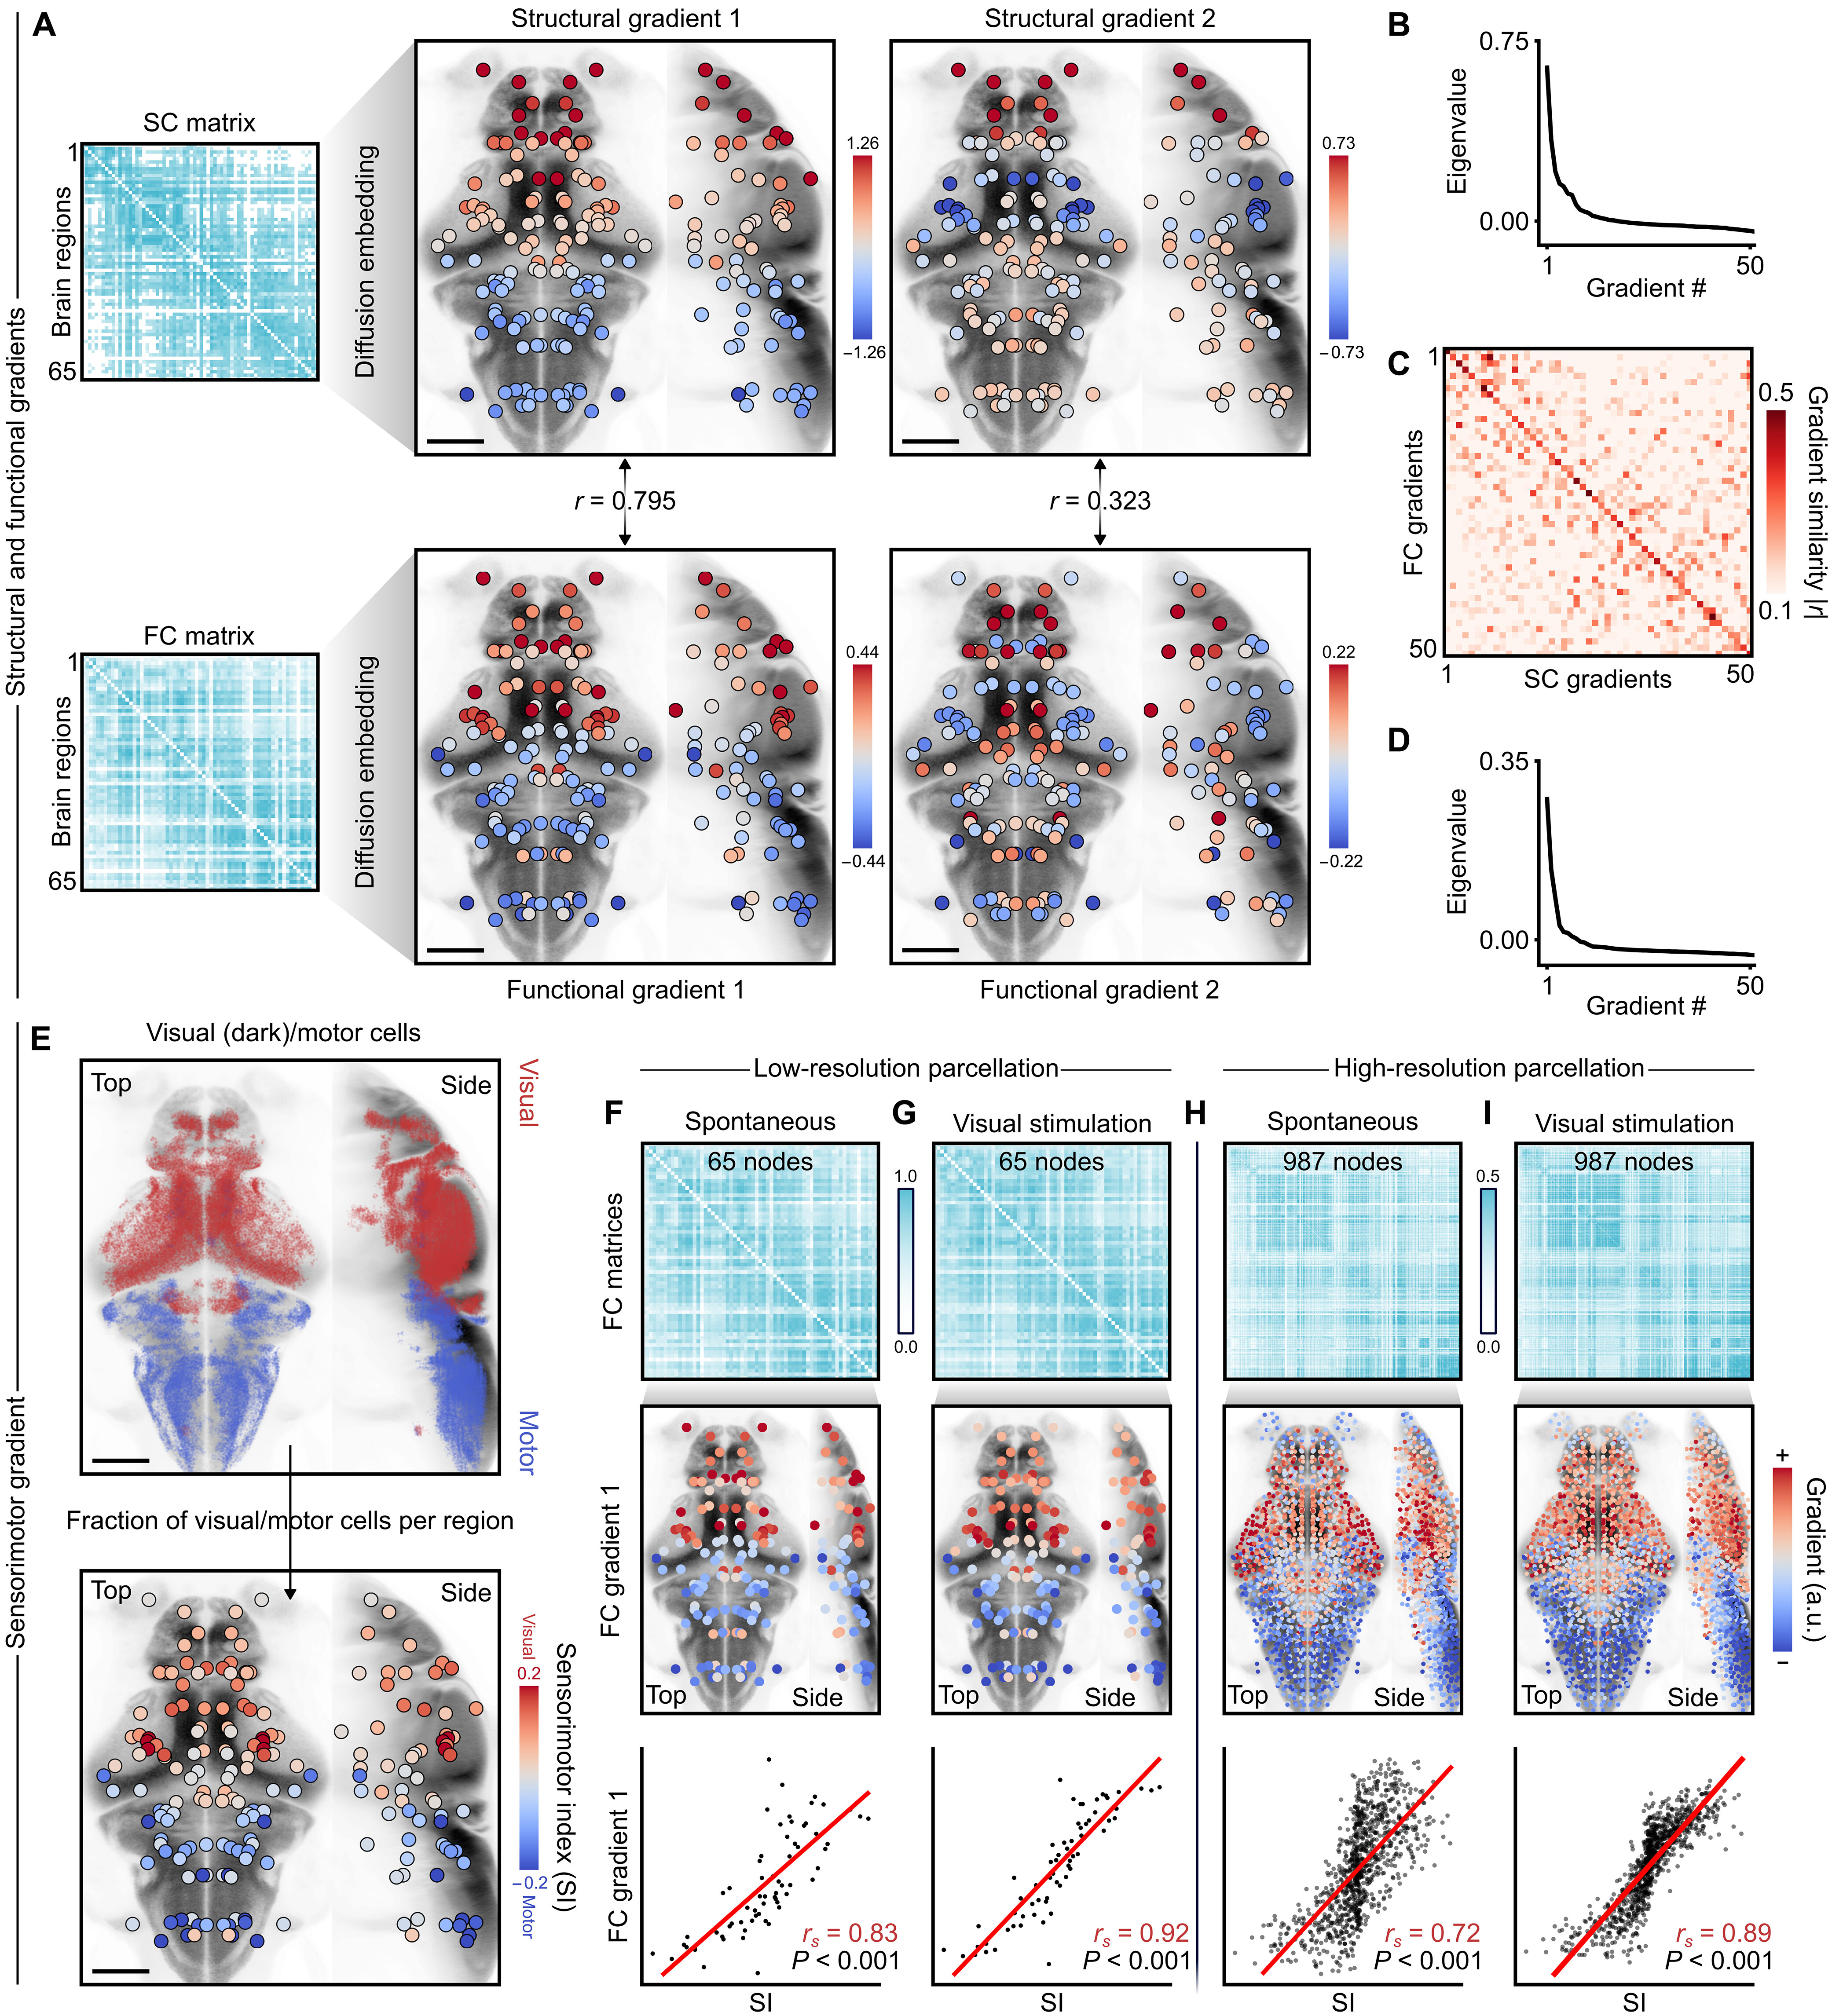
Fig. 6 Regional sensorimotor functions coincide with the main functional gradient. (A) top: Sc matrix and its first two diffusion gradients, with nodes denoting brainregion centroids. Bottom: Fc matrix and its first two diffusion gradients. (B) eigenvalues of the first 50 structural diffusion gradients. (C) Absolute correlation ∣ r ∣ betweenthe first 50 Sc and Fc gradients; functional gradients are reordered to optimally match the structural gradients. (D) eigenvalues of the first 50 functional gradients. (E) top:dark and motor-positive neuron centroids from Fig. 5, in red and blue, respectively. Bottom: Sensorimotor index of each brain region. (F) top: Fc matrix under spontane-ous conditions. Middle: First Fc gradient of the corresponding matrix above. Bottom: correlation between sensorimotor index (Si) and first Fc gradient. r s denotes theSpearman correlation coefficient, and P values are obtained through SA-preserving permutations (1000 permutations). (G) Similar to the previous panel, except with Fccomputed while including visual stimuli. (H) Similar to the previous panel, except with high-resolution Fc computed from spontaneous activity. (I) Similar to the previouspanel, except with high-resolution Fc computed while including visual stimuli. Scale bars, 100 μm.