IMAGE

Fig. 7.

ID
ZDB-IMAGE-250804-39
Source
Figures for Stark et al., 2025
Image
Figure Caption

Fig. 7.

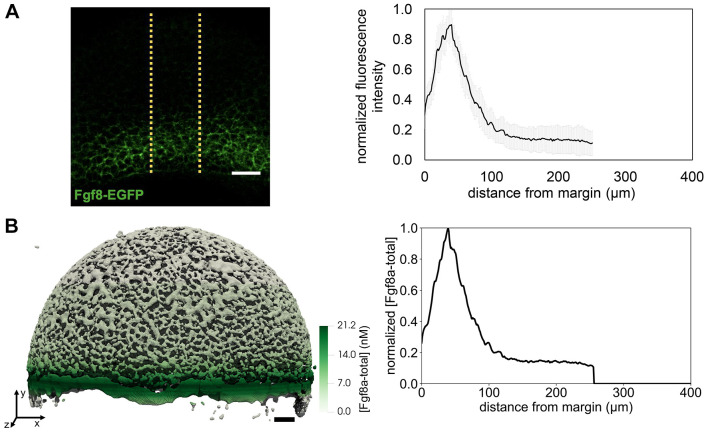
Initialization of the total Fgf8a concentration with the experimental fluorescence intensity profile at ≈60% epiboly. (A) The fluorescence intensity profile (right) is extracted from sum-intensity z-projected confocal images (left). Values are intensity averages across a 100 μm wide region (neural plate). Reproduced, with permission, from Harish et al. (2023). The embryo is oriented as in Fig. 1B (ventral left, dorsal right, animal pole top, vegetal pole bottom). N=15 embryos. Data are represented as mean±s.d. (B) The concentration field in the simulation (left) was obtained by linearly interpolating between the discrete margin distances of the experimental profile and uniformly distributing the mass in each xz-plane. We converted normalized intensity values to concentrations by scaling with the maximum concentration measured by FCS. For comparison with experiments, we computed 1D profiles (right) along the AV axis by averaging the total Fgf8a concentration in each xz-plane. The model has the same orientation as the embryo in A. Scale bars: 50 μm.

Acknowledgments
This image is the copyrighted work of the attributed author or publisher, and ZFIN has permission only to display this image to its users. Additional permissions should be obtained from the applicable author or publisher of the image. Full text @ Development