IMAGE

Fig. 3.

ID
ZDB-IMAGE-250804-33
Source
Figures for Stark et al., 2025
Image
Figure Caption

Fig. 3.

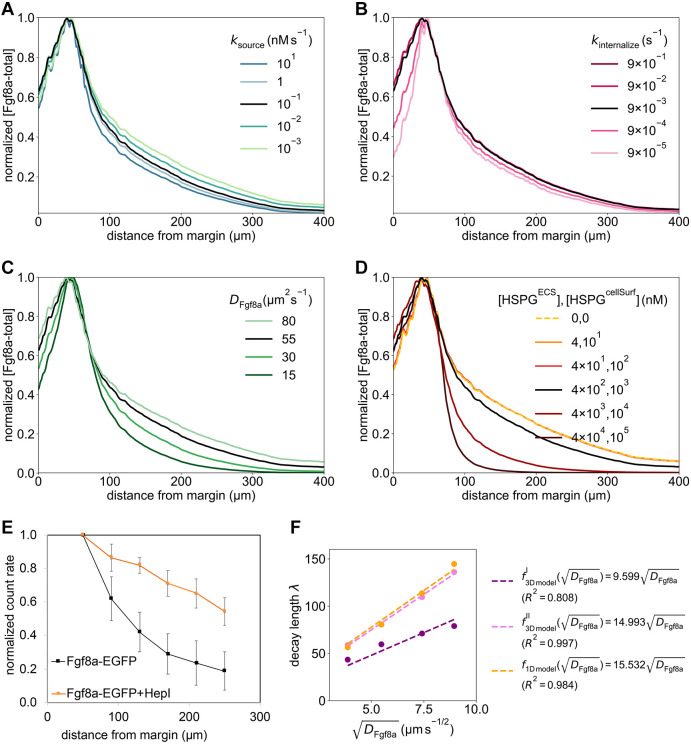
Sensitivity of the simulated steady-state Fgf8a gradients to variations in the model parameters and in vivo gradient sensitivity to HepI injection. (A,B) The normalized simulated gradient shows remarkable robustness against changes in source (A) and sink rates (B) over four orders of magnitude (see key). (C,D) Changes in the effective diffusivity, by changing either the molecular diffusion coefficient of Fgf8a (C) or HSPG concentrations (D), strongly affect the gradient. The higher the HSPG binding and the smaller the diffusion coefficient, the steeper and shorter the gradient. The baseline gradient (see the section ‘A SDD+HSPG-binding mechanism is sufficient to generate de novo Fgf8a gradients’) is shown as a solid black line in all panels. All profiles are normalized by their respective maximum xz-plane-averaged concentration. Profiles are shown at . (E) FCS count rates of Fgf8a without (black squares) and with (orange circles) HepI injection. HepI cleaves off the HS side-chain of HSPGs. The Fgf8a gradient of HepI-injected embryos is shallower. Reproduced, with permission, from Harish et al. (2023). N=20 embryos for control, N=13 for HepI; data are mean±s.d. (F) The gradient decay lengths λ scale linearly with the square root of the molecular diffusion coefficient of the morphogen, as expected for gradients forming by an SDD mechanism (Kicheva et al., 2012; Hidalgo et al., 2019 preprint). The linear fits show the least-squares solutions obtained using numpy.linalg.lstsq (Harris et al., 2020). The key provides the fitted proportionality coefficients and the respective goodness of fit R2.

Acknowledgments
This image is the copyrighted work of the attributed author or publisher, and ZFIN has permission only to display this image to its users. Additional permissions should be obtained from the applicable author or publisher of the image. Full text @ Development