
|
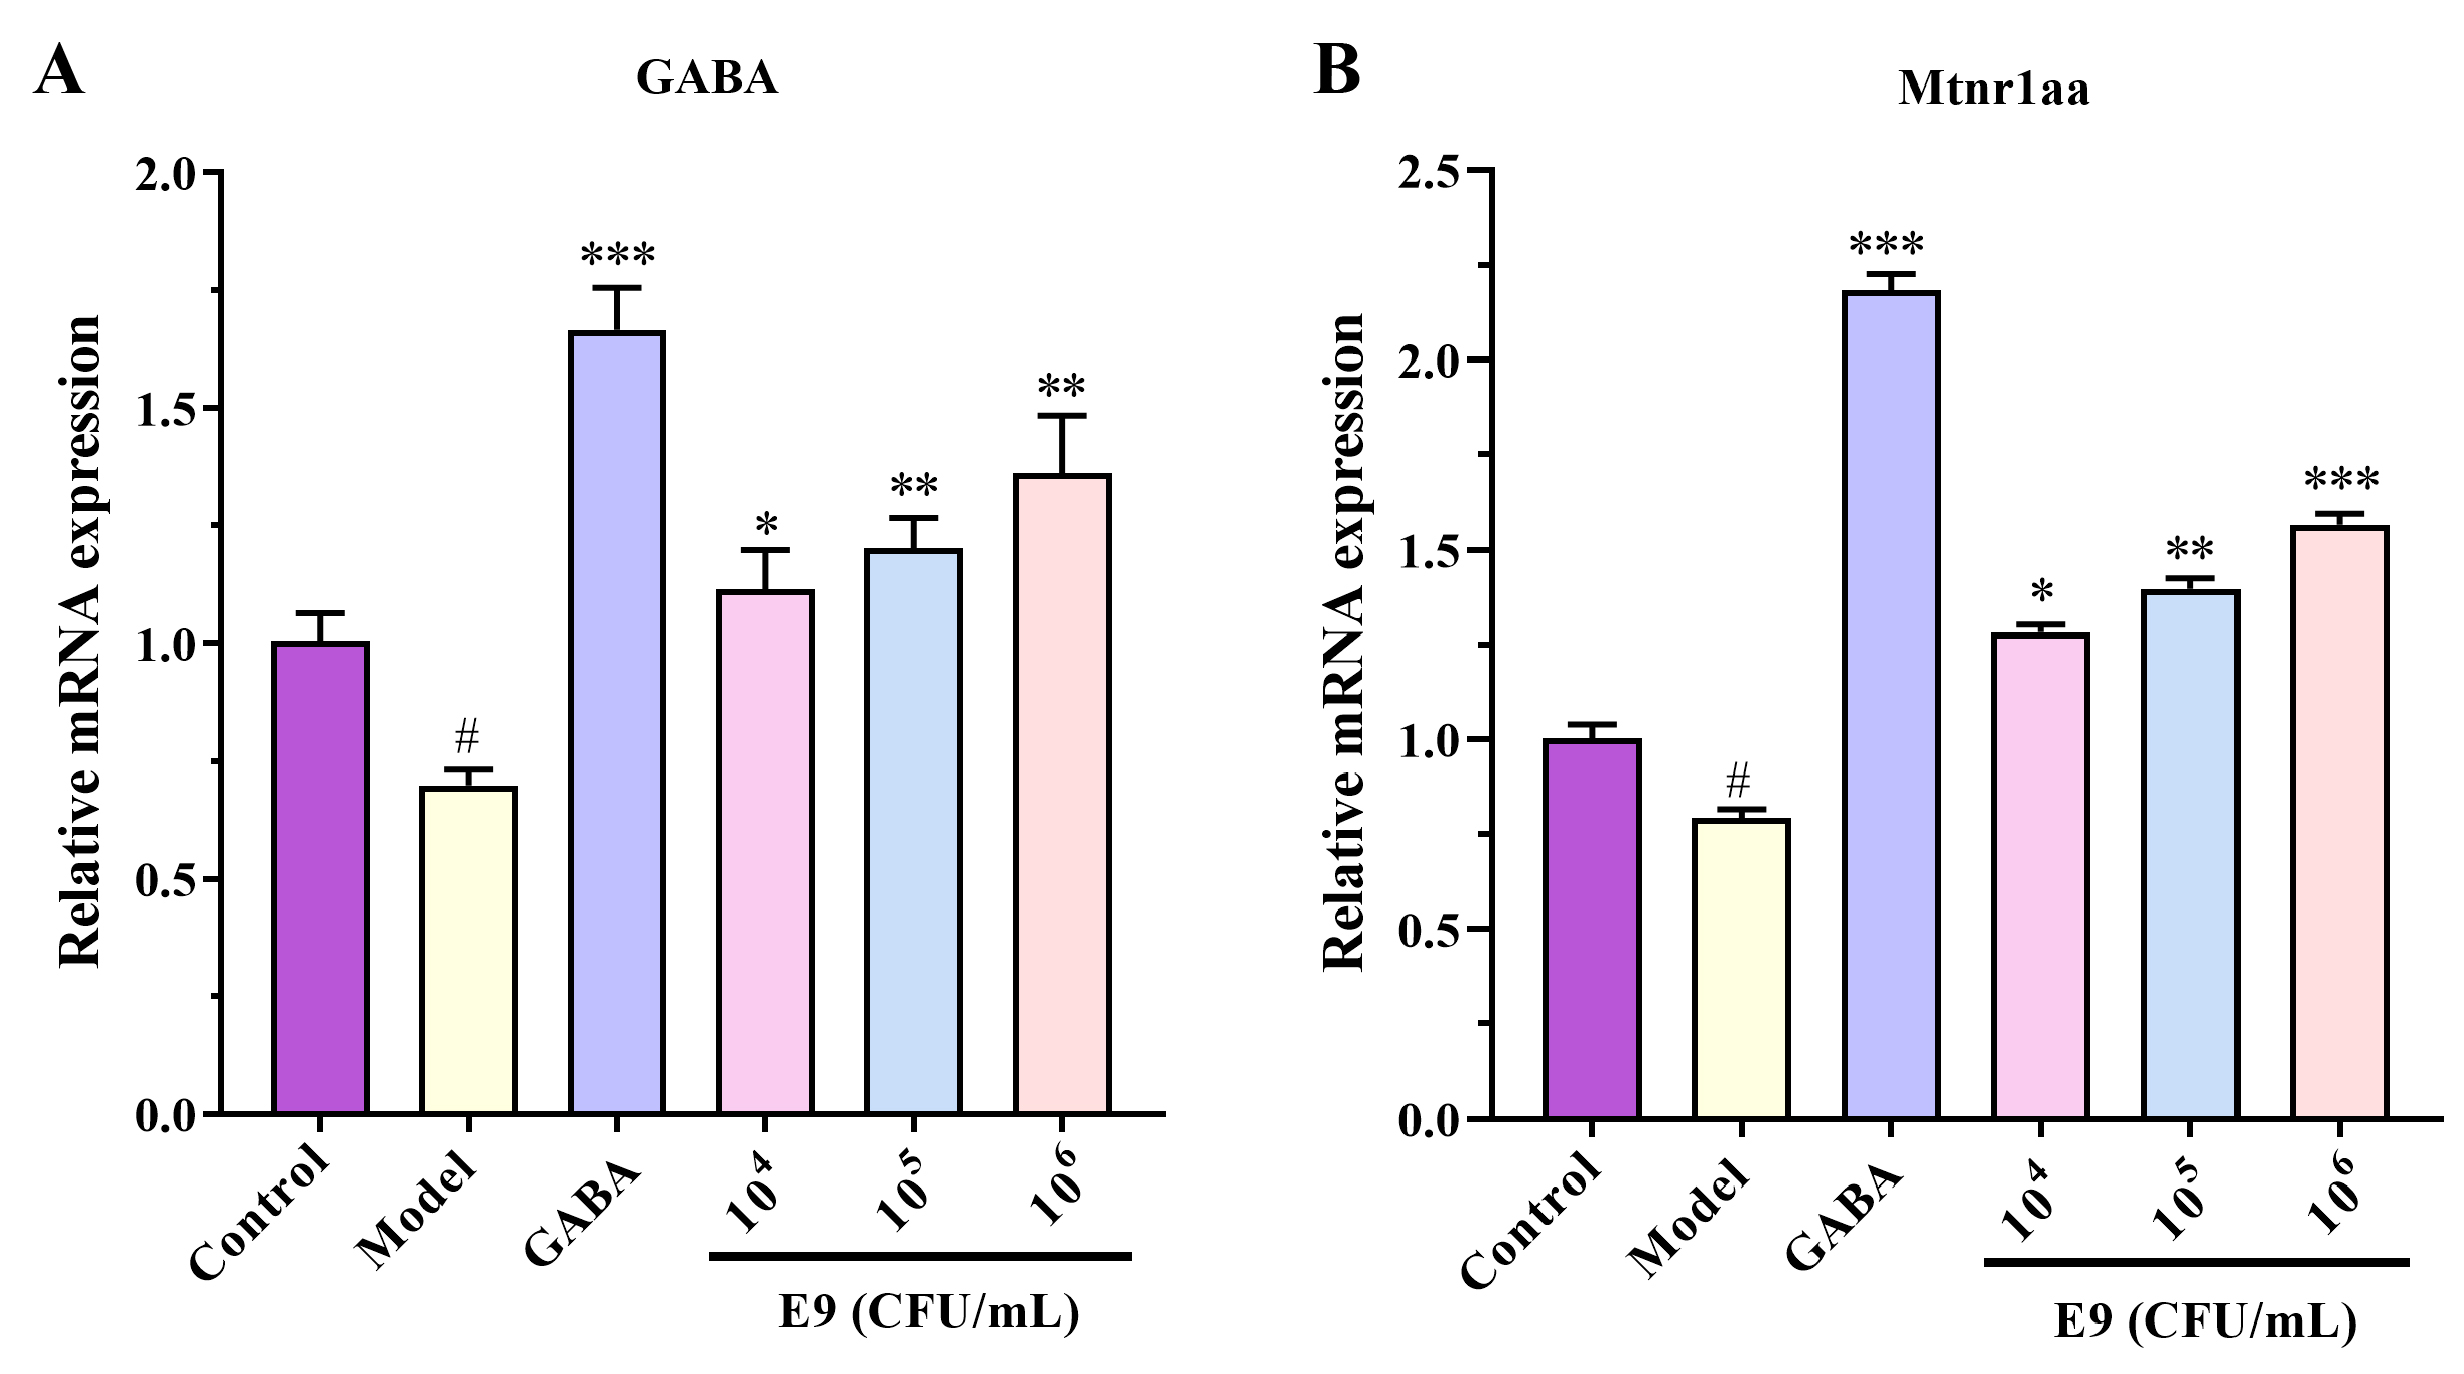
Fig. 4 Lactobacillus reuteri E9 upregulates GABA and melatonin receptor gene expression in zebrafish. Relative mRNA levels of (A) GABA receptor and (B) melatonin receptor 1aa (Mtnr1aa) in zebrafish brains. Data are normalized to β -actin and presented as fold change (mean ± SEM, n = 12 per group). # indicates a comparison between the normal group and the model group with # representing p < 0.05, * indicates a comparison between the sample group and the model group, with * representing p < 0.05, ** representing p < 0.01, and *** representing p < 0.001. Gene expression analysis was performed via qPCR.