
Fig. 1
- ID
- ZDB-IMAGE-250703-18
- Genes
- Publication
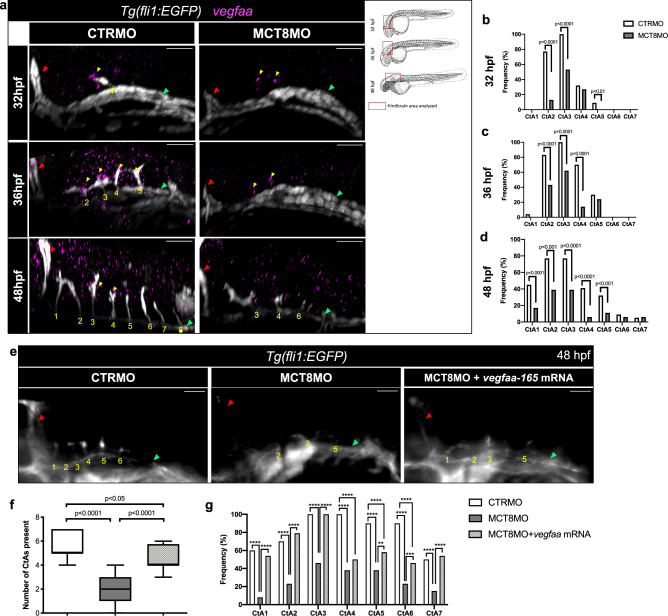
- Trindade et al., 2025 - Maternal thyroid hormone is required to develop the hindbrain vasculature in zebrafish
- All Figures
- Figures for Trindade et al., 2025
|
Fig. 1
MT3 regulates