
Image
|
Figure Caption
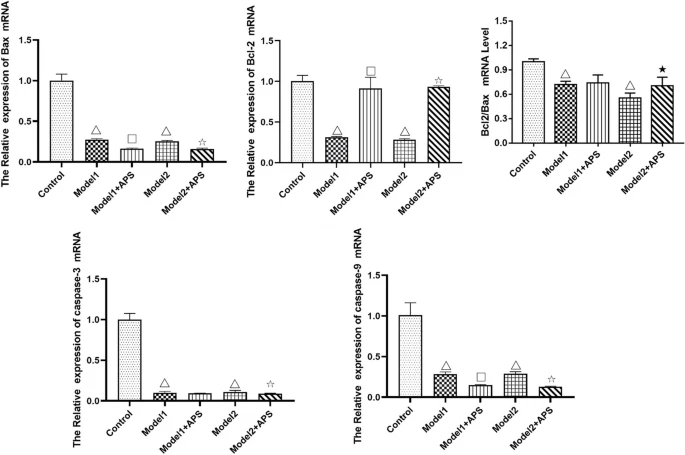
Fig. 7 Comparison of mRNA expression of Bax, Bcl-2, caspase-3 and caspase-9 of DCM zebrafish treated with APS. Data are presented as mean ± SD. n = 30. △P < 0.01, Compared with control; □P < 0.01, compared with model 1; ☆P < 0.01, compared with model 2; ★P < 0.05,compared with model 2
Acknowledgments
This image is the copyrighted work of the attributed author or publisher, and
ZFIN has permission only to display this image to its users.
Additional permissions should be obtained from the applicable author or publisher of the image.
Full text @ BMC Complement Med Ther