
|
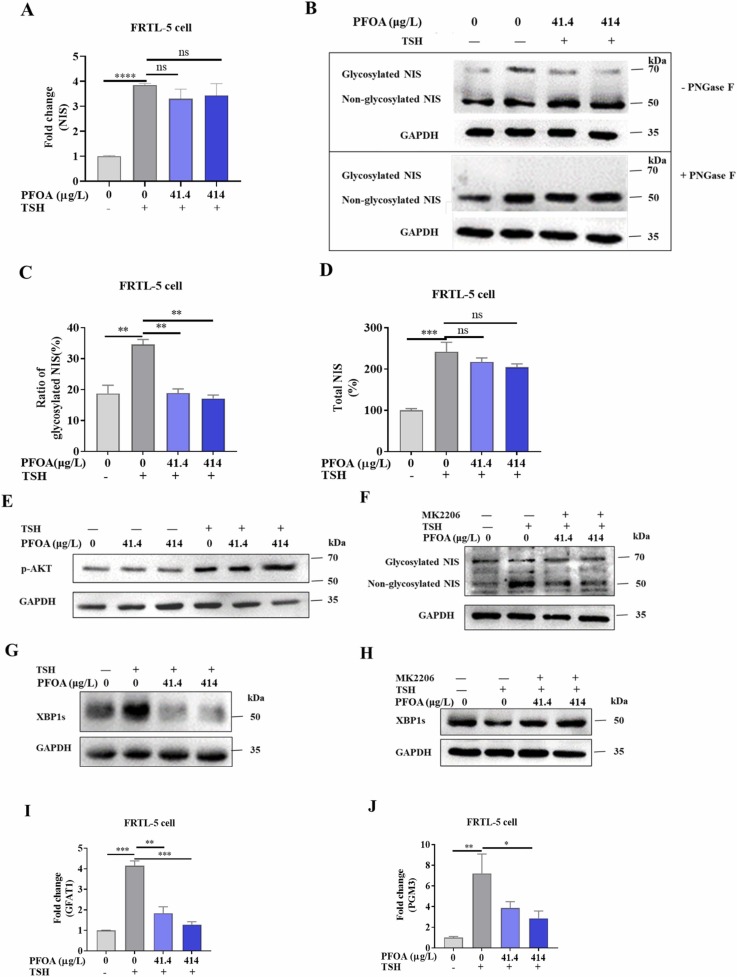
Fig. 4 The effect of PFOA on NIS and TSH-dependent signaling in FRTL-5 cells. A FRTL-5 cells were treated with various PFOA concentrations for 48 h, then the NIS mRNA levels were measured. B Cells were treated with different concentrations of PFOA for 48 h. Then, cell lysates were used to measure NIS expression and glycosylation using Western blot. GAPDH was used as a loading control for normalization. The band intensities were calculated using Image J software. The ratios of glycosylated NIS to non-total NIS (C) and the total NIS level (D) were plotted, respectively. PFOA-treated groups compared with the untreated group in the presence of TSH. E Cells were treated with different concentrations of PFOA for 30 min. After treatment, cells were lysed to detect AKT phosphorylation levels using Western blot. GAPDH was used as a loading control for normalization. F Cells were treated with TSH and different concentrations of PFOA in the presence of or in the absence of MK2206 for 48 h. Then, cells were lysed for Western blot analysis to detect NIS glycosylation levels. GAPDH was used as a loading control for normalization. G Cells were treated with different concentrations of PFOA with or without TSH for 48 h. Then, cells were lysed to measure XBP1s protein levels using Western blot. H Cells were treated with TSH and various concentrations of PFOA in the presence of or in the absence of MK2206 for 48 h. Then, cells were lysed to detect NIS glycosylation levels using Western blot. GAPDH was used as a loading control for normalization. I, J Cells were treated with different concentrations of PFOA for 48 h. Then, real-time PCR was performed to detect the transcription levels of GFAT1 (I) and PGM3 (J). 41.4 µg/L ( 0.1 µM); 414 µg/L ( 1 µM). One-way ANOVA with Tukey's HSD post hoc test,n = 3,*:p < 0.05; **:p < 0.01, ***:p < 0.001; ****:p < 0.0001). The treated groups were compared with the control group.