
|
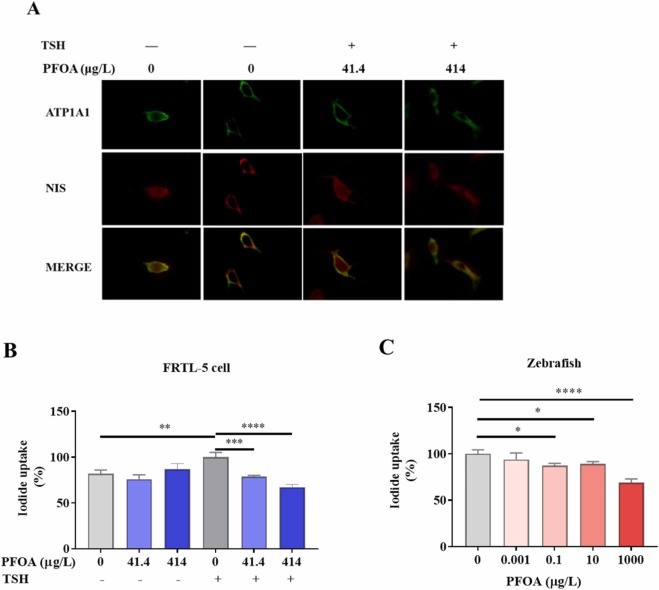
Fig. 3 PFOA disrupted membrane expression of NIS protein and inhibited iodine uptake. A Representative confocal immunofluorescence microscopy image of NIS localization in FRTL-5 cells after PFOA exposure for 48 h in the presence of TSH. ATP1A1 (Sodium/potassium-transporting ATPase subunit alpha-1) was used as a cell surface marker. NIS and ATP1A1 were visualized in red and green, respectively. Yellow fluorescence is equivalent to the co-localization of the NIS with ATP1A1. B Effect of PFOA exposure on iodide uptake in FRTL-5 cells. FRTL-5 cells were treated with various PFOA concentrations for 48 h, then the iodide uptake ability of FRTL-5 cells was measured. Treatment group compared with the TSH group. C Effect of PFOA exposure on iodide uptake in vivo. Zebrafish eggs were treated with different PFOA concentrations for 7 days. After treatment, the iodide uptake ability was measured. The treated groups were compared with the control group. 41.4 µg/L (0.1 µM); 414 µg/L (1 µM) One-way ANOVA with Tukey's HSD post hoc test,*:p < 0.05; **:p < 0.01, ***:p < 0.001; ****:p < 0.0001).