
|
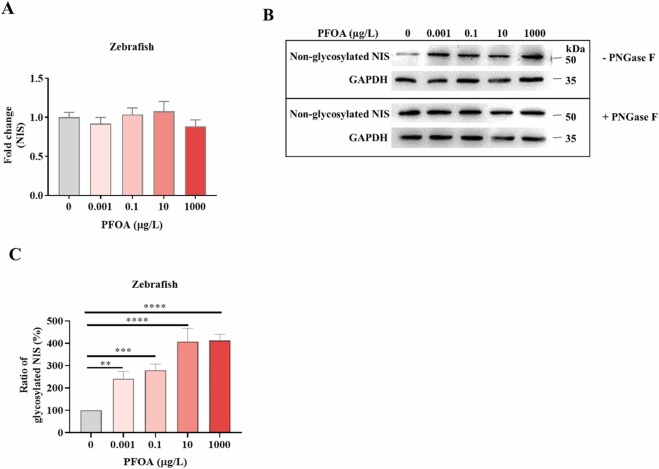
Fig. 2 The effect of PFOA on NIS mRNA levels and glycosylation of NIS protein in zebrafish larvae. A The zebrafish eggs were exposed to different PFOA concentrations for 7 days. Then, the mRNA levels were measured by real-time PCR. The treated groups were compared with the control group. n = 3. B zebrafish eggs were treated with different concentrations of PFOA for 7 days. NIS protein levels were analyzed using Western blot. GAPDH was used as a loading control for normalization. C The band intensities were calculated using Image J software. The ratios of glycosylated NIS to non-glycosylated NIS were plotted. one-way ANOVA with Tukey's HSD post hoc test,n = 3,**:p < 0.01, ***:p < 0.001; ****:p < 0.0001). The treated groups were compared with the control group.