
|
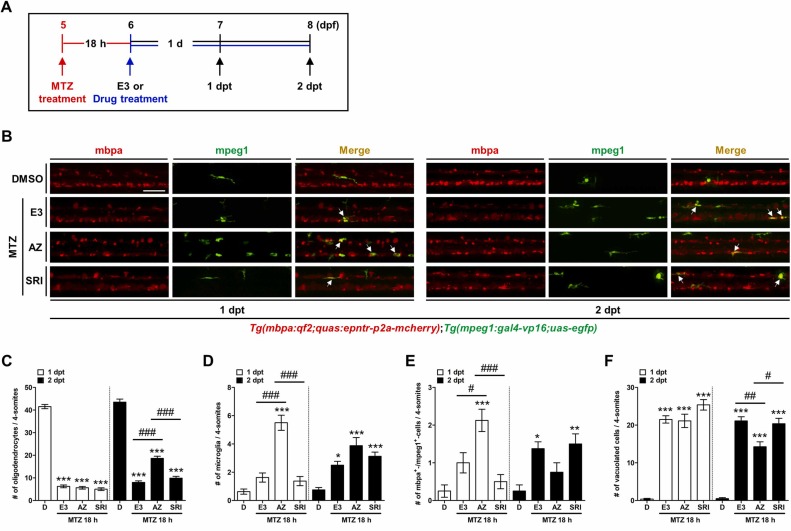
Fig. 5 TGF-βRI kinase inhibitor increases immune responses in the early stages after oligodendrocyte ablation. (A) Schematic representation of the treatment protocols using Tg(mbpa:qf2;quas:epntr-p2a-mcherry); Tg(mpeg1:gal4-vp16;uas-egfp) zebrafish larvae. (B) Lateral views of the spinal cord of transgenic zebrafish larvae at 7 and 8 days post-fertilization (dpf), anterior to the left and dorsal to the top. In the spinal cord, fluorescence indicates mbpa+-OLs, mpeg1+-microglia, and phagocytic clearance of cellular debris by microglia (mbpa and mpeg1 double-positive cells, white allow). (C-F) Numbers of mbpa+-, mpeg1+-, mbpa+mpeg1+-, and vacuolated cells in each 4-somite area 1 and 2 days post-treatment (dpt). The experiment was repeated thrice. The data are presented as the mean ± SD; n ≥ 11 independent experiments. P-values were calculated using one-way ANOVA followed by Tukey’s test. Significance is indicated by *P < 0.05, **P < 0.01, and ***P < 0.001 vs. DMSO; #P < 0.05, ##P < 0.01, and ###P < 0.001 vs. MTZ 18 h + E3 or MTZ 18 h + AZ. Scale bar: 200 μm.