
|
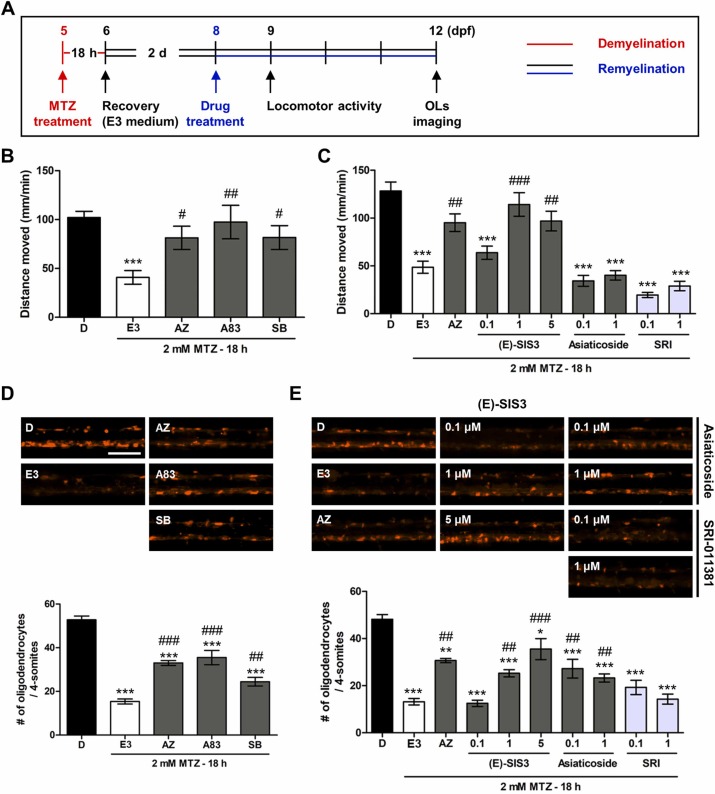
Fig. 3 Pharmacological control of the TGF-β1 signaling pathway affects locomotor activity and oligodendrocyte regeneration. (A) Schematic representation of the treatment protocols using Tg(mbpa:qf2;quas:epntr-p2a-mcherry) zebrafish larvae. The zebrafish larvae were treated with 2 mM metronidazole (MTZ) for 18 h 5 days post-fertilization (dpf). After that, they were maintained in E3 medium and treated with AZ-12601011 (10 nM), A83–01 (10 nM), SB-505124 (50 nM), (E)-SIS3 (0.1, 1, and 5 μM), asiaticoside (0.1 and 1 μM), and SRI-011381 (0.1 and 1 μM) for 1 and 4 days. (B) Effects of TGF-βRI kinase inhibitors on distance moved 9 dpf. (C) Changes in distance moved at 9 dpf when the TGF-β signaling pathway was inhibited by pharmacological drugs. (D, E) Lateral views of the spinal cord of transgenic zebrafish larvae at 12 dpf, anterior to the left and dorsal to the top. In the spinal cord, fluorescence indicates mbpa+-OLs. The graphs show the number of oligodendrocytes (OLs) in each 4-somite area. The experiment was repeated thrice. The data are presented as the mean ± SD; n ≥ 10 independent experiments. P-values were calculated using one-way ANOVA followed by Tukey’s test. Significance is indicated by *P < 0.05, **P < 0.01, and ***P < 0.001 vs. DMSO; #P < 0.05, ##P < 0.01, and ###P < 0.001 vs. MTZ 18 h + E3. Scale bar: 200 μm.