
|
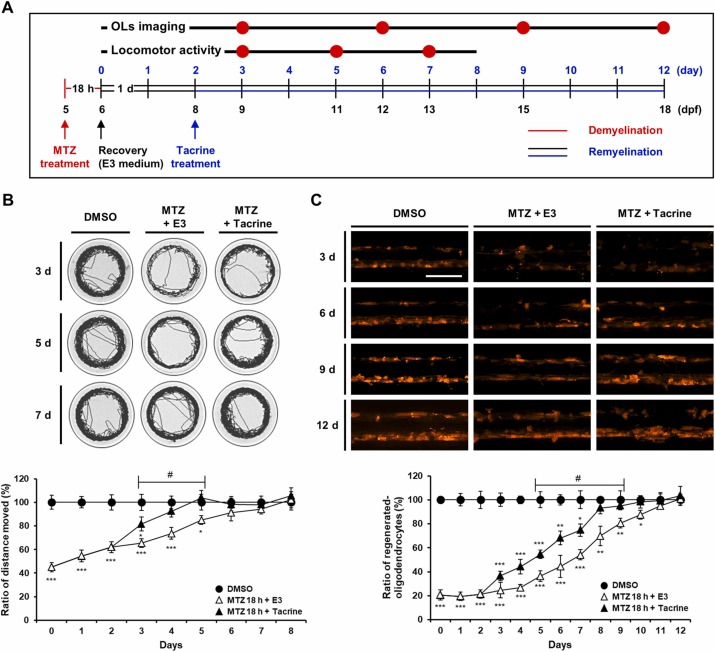
Fig. 2 The optimal time point for screening is determined by the change in improved point achieved by tacrine treatment after demyelination. (A) Schematic diagram for demyelination and remyelination assay conditions using Tg(mbpa:qf2;quas:epntr-p2a-mcherry) zebrafish larvae. (B) Representative tracking image of a 5-min recording at 9, 11, and 13 days post-fertilization (dpf). The graph shows the ratio of the distance moved at 6–14 dpf. (C) Lateral views of the spinal cord of transgenic zebrafish larvae at 9, 12, 15, and 18 dpf, anterior to the left and dorsal to the top. In the spinal cord, fluorescence indicates mbpa+-OLs. The graph shows the ratio of the oligodendrocyte (OL) number in each 4-somite area at 6–18 dpf. The experiment was repeated thrice. The data are presented as the mean ± SD. n ≥ 10 independent experiments. P-values were calculated using one-way ANOVA followed by Tukey’s test. Significance is indicated by *P < 0.05, **P < 0.01, and ***P < 0.001 vs. DMSO; #P < 0.05 vs. MTZ 18 h + E3. Scale bar: 200 μm.