
|
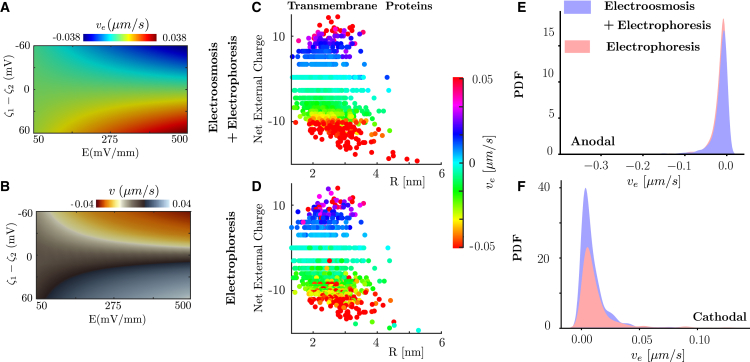
Fig. 3 Effect of an electric field in CMPs Color map of the model results for (A) electromotility and (B) migration velocities. The results are computed for a -potential difference in a range of −60 to 60 and an EF stimulus in a range of 50–500 . (C) Results of electromigration velocities on transmembrane proteins when electroosmosis and electrophoresis are active and (D) when electroosmotic flows have been canceled. (E and F) For those proteins that electromigrate toward the cathode and the anode, we compute the PDF for the control (electro-osmosis + electrophoresis) and the modified system (only electrophoresis). The PDFs have been normalized by using multivariable analysis, meaning that the sum of the areas for the two distributions adds to 1—this helps visualize which case dominates in that particular velocity regime.