
|
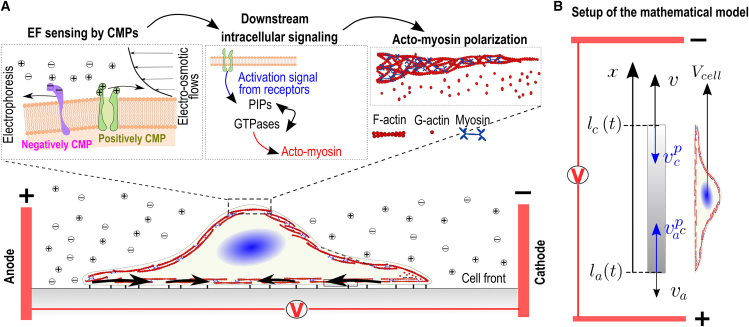
Fig. 1 Mechanisms and model description (A) Sketch of the main processes involved in electrotaxis. Left box: Two competing forces polarize charged cell membrane components. First, an EF exerts forces on the net electric charge of the cell membrane, pulling it in a certain direction (electrophoresis). The generation of an electroosmotic flow by the EF that transports soluble ions and fluid outside the cell (electroosmosis) also generates drag forces on the membrane proteins. Middle box: The polarization of membrane components induces intracellular signals involved in the cell polarization of the actomyosin network that controls the direction of migration (right box). (B) A 1D electrotaxis model couples CMPs polarization, intracellular signals, and gel active models (see STAR Methods for details on the description of model variables and governing equations) to establish the cell migration velocity (direction and magnitude). The retrograde flow, , (black arrows) moves from the cathodal and anodal cell front inwards (sub-indexes c and a in the variables, respectively). The polymerization velocity (, blue arrow) points outwards from the cell membrane. The position of the apical side of the cell is denoted by and the one facing the cathodal one is denoted by .