
|
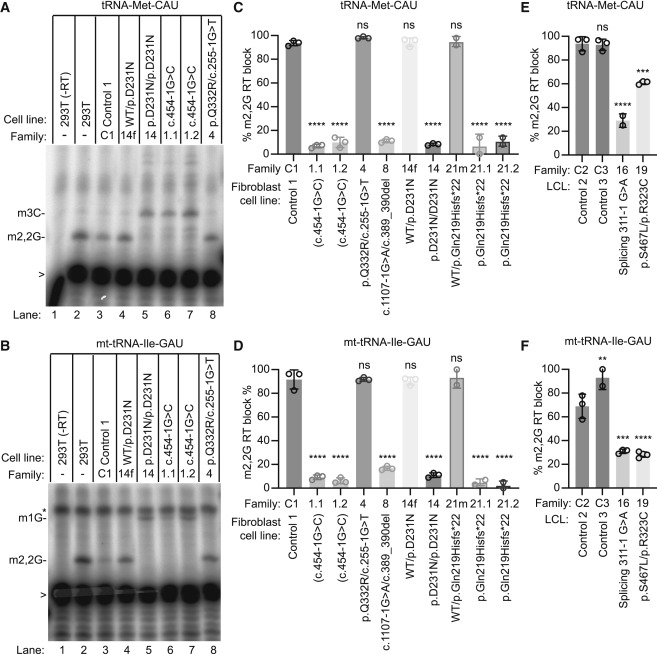
Fig. 4 Human cell lines with bi-allelic TRMT1 variants exhibit a reduction in m2,2G modifications in tRNAs (A and B) Representative gels of primer extension assays to monitor the presence of m2,2G in tRNA-Met-CAU and mt-tRNA-Ile-GAU from the indicated cell lines. m3C20, 3-methylcytosine; m2,2G26, dimethylguanosine; m1G9, 1-methylguanosine. “>” points to labeled oligonucleotide used for primer extension; asterisk denotes background signal. (C–F) Quantification of m2,2G formation by primer extension for the indicated tRNAs. % m2,2G RT block represents the m2,2G stop signal divided by the sum of the m2,2G and read-through m3C or m1G stop signal. The number of replicates is shown in each bar graph with a minimum of two replicates per cell line. Error bars represent standard deviation from the mean. Statistical analysis was performed using one-way ANOVA. For (C) and (D), the mean of each column was compared to the control 1 cell line. For (E) and (F), the mean of each column was compared to the control 2 cell line. ∗p ≤ 0.05, ∗∗p ≤ 0.01, ∗∗∗p ≤ 0.001, ∗∗∗∗p < 0.0001; ns, non-significant (p > 0.05).