
|
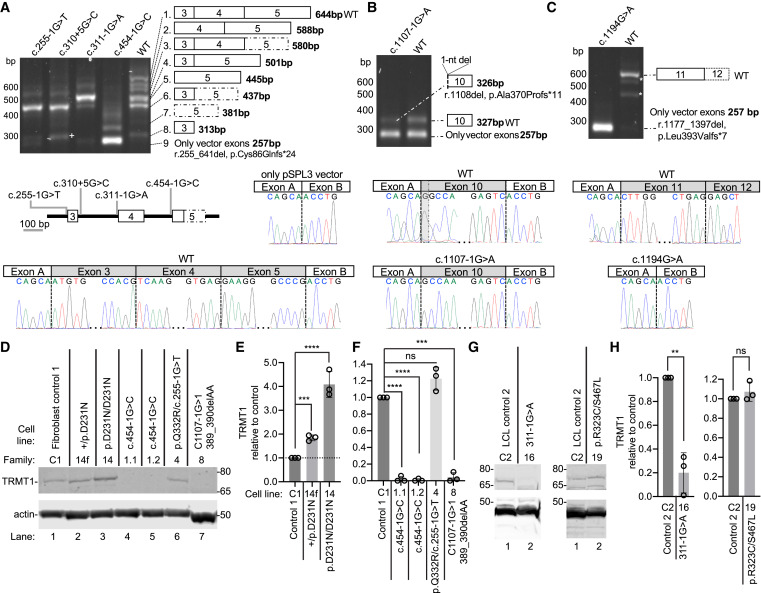
Fig. 3 TRMT1 variants induce splicing defects and changes in TRMT1 protein levels (A) RT-PCR analysis of RNA from HEK293T cells transfected with TRMT1 minigenes. The presence of additional bands in the WT is attributed to alternative splicing and quantified in Table S7. The splicing schematic is shown for each band to the right. The variant schematic is shown below. Sanger sequencing results showing the correctly spliced WT product with the deleterious variant effect, exon skipping, shown by the presence of only pSPL3 vector. The dotted box represents the short version of exon 5. (B) RT-PCR analysis of RNA from cells transfected with the c.1107−1G>A minigene. The splicing schematic is shown for each band to the right. Exon 10 with 1-bp deletion is represented with a dotted line corresponding to the single-bp deletion. (C) RT-PCR of the c.1194G>A variant. Asterisks represent assay artifacts. The splicing schematic is to the right. Assay design captured part of exon 12 that was correctly spliced in the WT control. (D) Immunoblot of lysates from fibroblast cell lines derived from control (C1) or affected individuals. (E and F) Quantification of TRMT1 levels relative to the control fibroblast cell line after normalization to actin. (G) Immunoblot of lysates from lymphoblast cell lines (LCLs) derived from control WT (C2) or affected individuals. (H) Quantification of TRMT1 levels in LCLs after normalization to actin. n = 3. Error bars represent standard deviation from the mean. Statistical analysis was performed using one-way ANOVA. ∗p ≤ 0.05, ∗∗p ≤ 0.01, ∗∗∗p ≤ 0.001, ∗∗∗∗p < 0.0001; ns, non-significant (p > 0.05).