
|
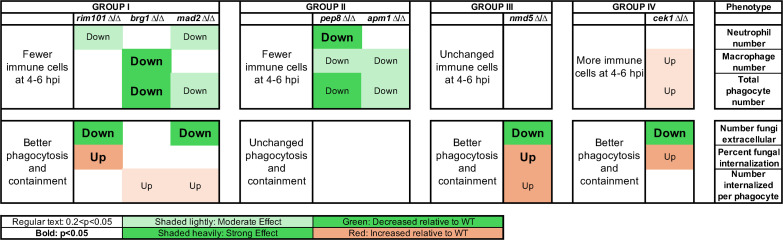
Fig 4
Mutants grouped by altered innate immune response. Mutant–phagocyte interactions were scored at 4–6 hpi, relative to wild-type fungi–phagocyte interactions in the same experiment, as to immune cell number and phagocytosis efficiency traits. Group I mutants had lower numbers of recruited phagocytes and better phagocytosis and containment. Group II mutants had fewer recruited phagocytes and unchanged phagocytosis efficiency. The Group III mutant had no change in phagocyte recruitment but better phagocytosis. The Group IV mutant had higher phagocyte recruitment and better phagocytosis. “Down” or “up” text indicates the direction of differential immune response, bold lettering indicates