
IMAGE
Figure 1
- ID
- ZDB-IMAGE-250510-3
- Publication
- Aranda-Martínez et al., 2025 - Lack of asmt1 or asmt2 Yields Different Phenotypes and Malformations in Larvae to Adult Zebrafish
- All Figures
- Figures for Aranda-Martínez et al., 2025
Image
|
Figure Caption
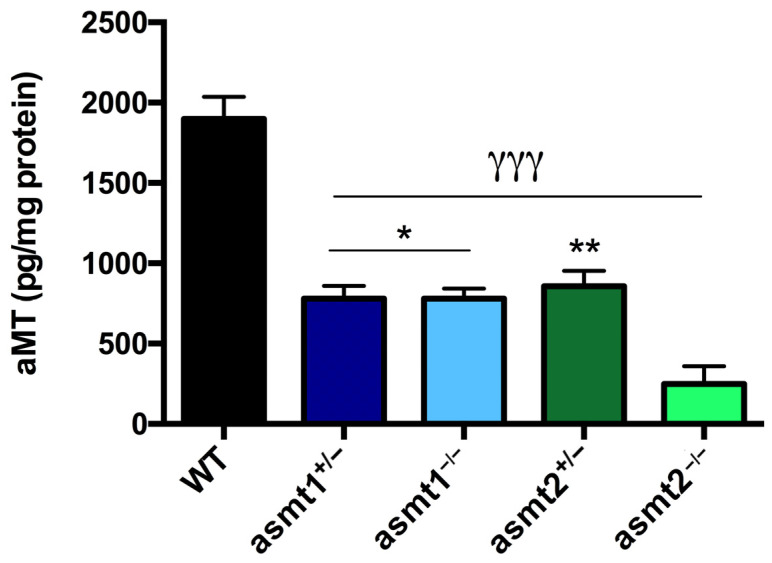
Figure 1
Melatonin concentration in zebrafish larvae. asmt1+/−, asmt1−/−, and asmt2+/− showed a significant reduction of 50% compared to WT. asmt2 −/− revealed an even greater decrease compared to the WT and the other mutant lines. Data are presented as mean ± SEM (
Figure Data
Acknowledgments
This image is the copyrighted work of the attributed author or publisher, and
ZFIN has permission only to display this image to its users.
Additional permissions should be obtained from the applicable author or publisher of the image.
Full text @ Int. J. Mol. Sci.