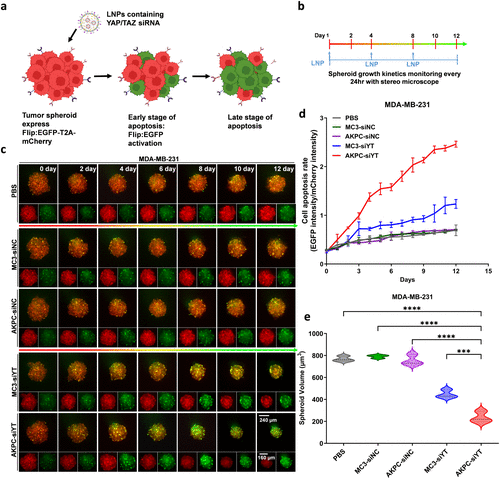
Fig. 5 Antitumor effect of AKPC-siYT in 3D tumor spheroids of MDA-MB-231. a, Schematic representation of the plasmid containing EGFP-T2A-Caspase3-mCherry (cell apoptosis sensor). b, Schematic representation of seeding and treatment of spheroids to monitor spheroid growth kinetics. On days 1, 4, and 8, LNPs were used to treat MDA-MB-231-derived spheroids in different groups (siRNA, 2 μg/mL). A stereo microscope was used to record the tumor spheroids each day for 12 consecutive days. c, Images of representative MDA-MB-231 spheroids over time after treatments with LNPs (MC3-siNC/AKPC-siNC: LNPs contain a negative control of siRNA; MC3-siYT/AKPC-siYT: LNPs contain a siYAP and siTAZ mixture), Flip:EGFP intensity (in green) represents cell apoptosis. d, Kinetics of the cell apoptosis rate (EGFP intensity/mCherry intensity) from MDA-MB-231 spheroids over time after treatments with LNPs. e, MDA-MB-231 spheroids volume calculated by image J on day 12. Ordinary one-way ANOVA was used to determine the significance of the comparisons of data (*p < 0.05; **p < 0.01; ***p < 0.001; ****p < 0.0001). In all panels, error bars represent mean ± s.d. (n = 3).
Image
Figure Caption
Acknowledgments
This image is the copyrighted work of the attributed author or publisher, and
ZFIN has permission only to display this image to its users.
Additional permissions should be obtained from the applicable author or publisher of the image.
Full text @ ACS Nano

