
|
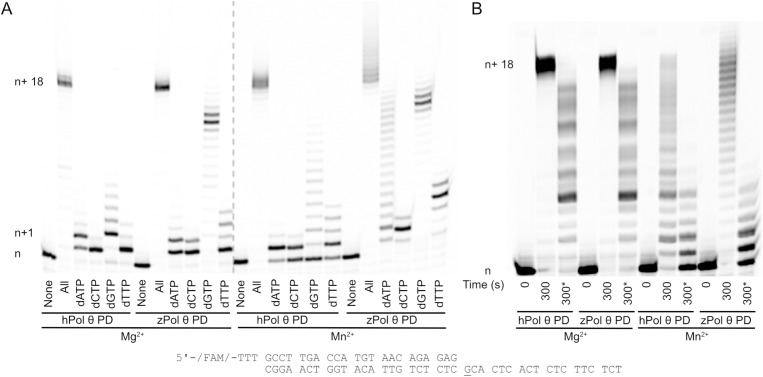
Fig 4 zPol θ PD experiences greater nucleotide extension activity compared to hPol θ PD.
Denaturing gel showing primer extension dsDNA substrate with MgCl2 and MnCl2. (A) Under steady-state conditions 50 nM hPol θ or zPol θ PD proteins were preincubated with 200 nM 25/40 dsDNA and combined with either 10 mM MgCl2 or MnCl2 for 5 minutes at 37°C. (B) The assay was repeated under steady-state conditions, with 10 nM Pol θ and 25 nM 25/40 dsDNA. Reactions were initiated with 100 µM dNTPs, 10 mM MgCl2 or MnCl2, and 75-fold excess of unlabeled 25/40 dsDNA for 5 minutes at 37°C (indicated by a *). DNA extension products were separated on a denaturing gel and visualized on a Typhoon scanner. Each n+1 band represents an extension of one nucleotide following the DNA template as described above. n+1 would represent either correct nucleotide incorporation of dCTP opposite a templating G (underlined) or a misincorporation event of dATP, dGTP, or dTTP opposite templating G. Each subsequent band is another nucleotide extension with a maximum template-dependent extension of n+18. Bands migrating higher than n+18 represent de novo synthesis.