
|
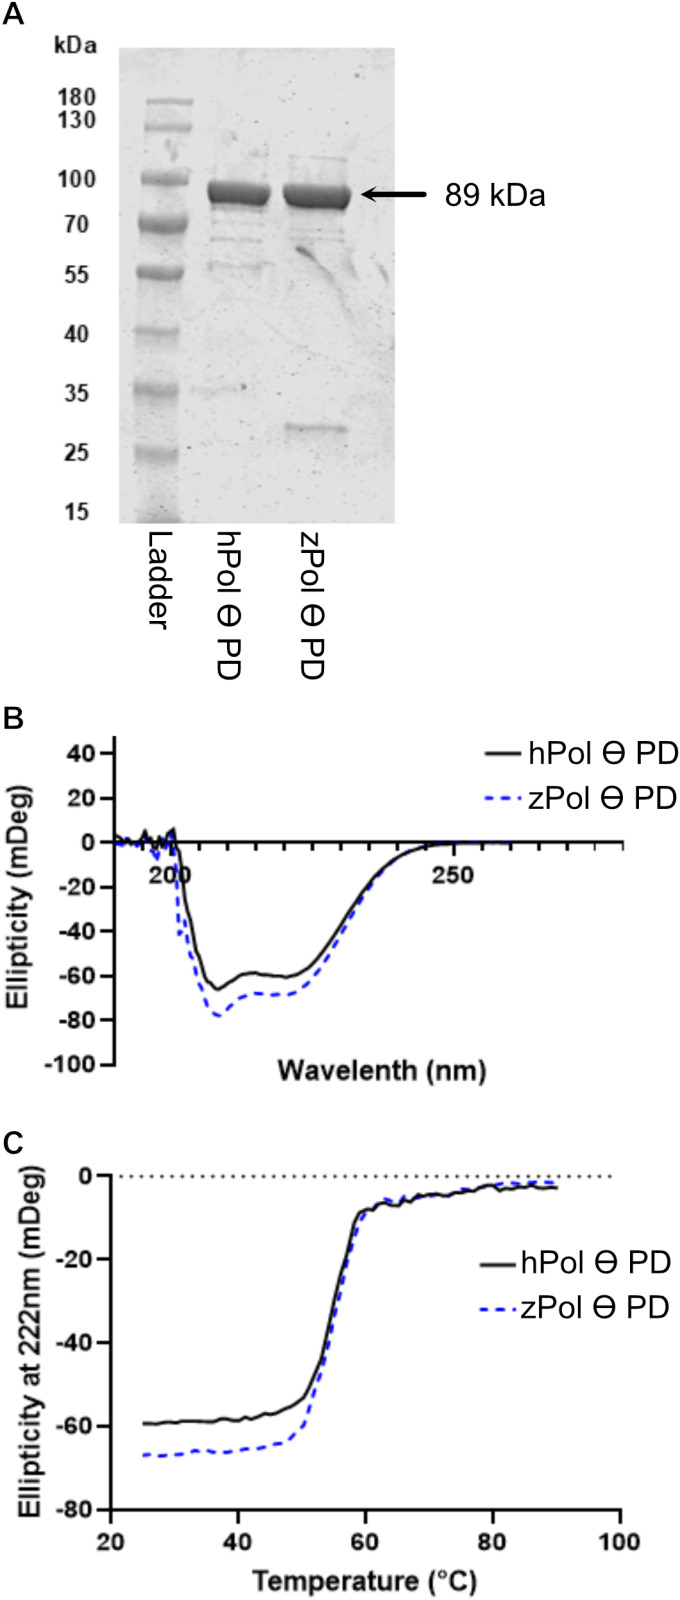
Fig 2 hPol θ and zPol θ PDs display similar secondary characteristics and thermal stability.
(A) SDS-PAGE of purified hPol θ PD and zPol θ PD. Expression and purification of zPol θ PD was the same as hPol θ PD as described in the Materials and Methods. For each sample, approximately 56–60 pmol of cleaved, purified protein were loaded on a 10% SDS PAGE and Coomassie stained. Both hPol θ and zPol θ PD fragments migrate to approximately 90 kDa as expected. (B) Circular dichroism spectra of 3 μM hPol θ PD (solid line) and zPol θ PD (dashed) proteins in 10 mM Potassium Phosphate buffer. Samples were scanned from 190 to 280 nm. (C) The same samples were heated from 20–90°C and ellipticity measured at 222 nm.