
|
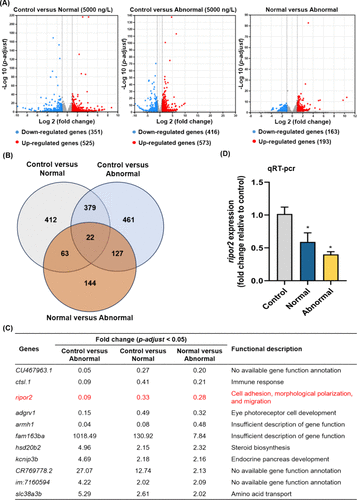
Fig. 3 Numbers of significant differently expressed genes in 9 hpf offspring zebrafish embryos between the control (normal epibolic embryos) and 5000 ng/L (normal and abnormal epibolic embryos) (A, n = 3). Up- and down-regulated genes were indicated by red and blue dots, respectively. Venn diagram of these significant differently expressed genes in offspring embryos (B). Concurrently up- or down-regulated genes were identified across three comparisons: control versus normal (5000 ng/L), control versus abnormal (5000 ng/L), and normal versus abnormal both in 5000 ng/L, as well as the fold changes of expression levels and functional descriptions of these genes (C). Expression of ripor2 in 9 hpf offspring embryos in the control and 5000 ng/L (normal and abnormal) groups (D, n = 6, two technical replicates for each experimental replicate).