
|
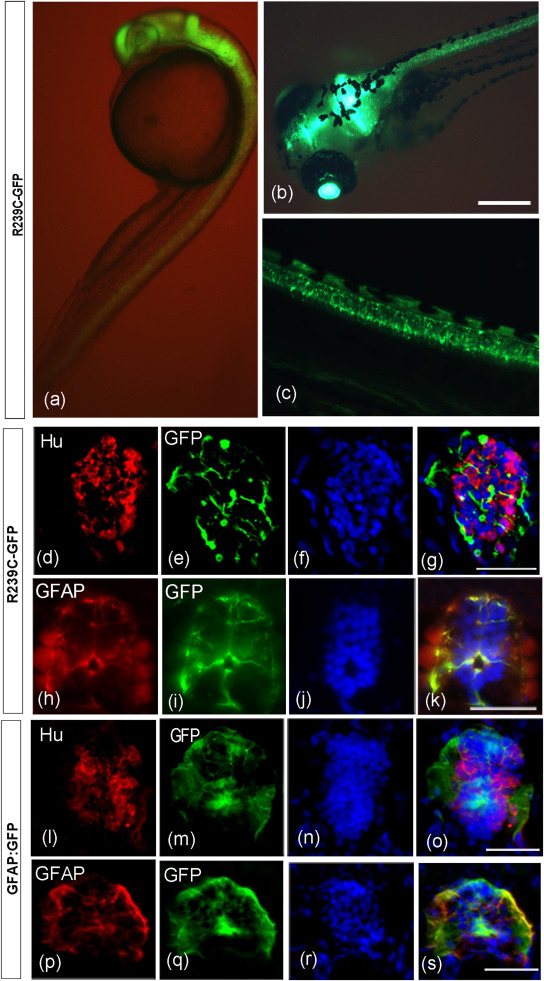
Fig. 2 Expression of GFP in the Tg(gfap:hGFAP(R239C)-GFP) transgenic zebrafish line at 24 hpf and 10 dpf. (a) Side view of a 24 hpf embryo. (b) anterior dorsal view of a 10 dpf larva, while (c) is a lateral view of the posterior part of the same larva. (d–s) GFP expression in larvae of Tg(gfap:hGFAP(R239C)-GFP) (indicated as R239C-GFP) and Tg(gfap:GFP)mi2001 (indicated as gfap:GFP) at 10 days post-fertilization (dpf) was analyzed alongside comparisons to glial and neuronal markers in cryosections of the brain. (d) Immunostaining with anti-HuC/D (red) revealed labeling of ventrolateral neurons in the brain, distinct from GFP-positive cells (e). Merged imaging in (g) confirmed the absence of colocalization between anti-HuC/D and GFP signals. (h) Anti-GFAP staining (red) highlights intermediate filaments in the brain. (t) Cells labeled with anti-GFAP also exhibited GFP expression (green), as depicted in the overlay image (k), indicating co-localization of anti-GFAP and GFP signals. (l–o) Immunostaining with anti-HuC/D (l, red) revealed labeling of ventrolateral neurons in the brain of gfap:GFP control line, distinct from GFP-positive cells lining the ventricle and extending processes towards the pial surface (m, green). Neither colocalization was visible in merged images (o). (p-s) Cells in the brain stained with the GFAP antibody (p) colocalized with GFP expressing cells (q,s). Labeled nuclei by Hoechst are shown in panels f, j, n, r. The scale bar is 50 μm in panels a, d-s and 100 μm in panels c, b.