
|
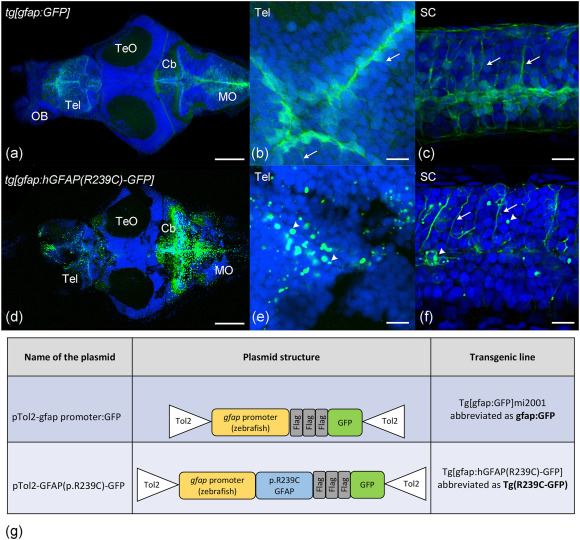
Fig. 1 Confocal images of Tg(gfap:GFP)mi2001 and the Tg(gfap:hGFAP(R239C)-GFP) transgenic zebrafish lines at 10 dpf. (a) Whole brain of a control Tg(gfap:GFP)mi2001 zebrafish larva at low magnification in dorsal view. (b,c) Enlargement of the telencephalic (b) and spinal cord (c) regions of the same larva showing the elongated pattern of GFP-positive cells (arrows). (d) Whole brain of a Tg(gfap:hGFAP(R239C)-GFP) zebrafish larva at low magnification in dorsal view. (e,f) Enlargement of the telencephalic (e) and spinal cord (f) regions of the same larva showing the presence of both GFP-positive aggregates (arrowheads) and the elongated pattern. In all panels, nuclei are shown in blue. The scale bar is 100 μm in panels a and d, and 10 μm in all other panels. Abbreviations: Cb, cerebellum; MO, medulla oblongata; OB, olfactory bulb; SC, spinal cord; Tel, telencephalon; TeO, tectum opticum. Plasmids used to generate transgenic lines are shown in (g).