
|
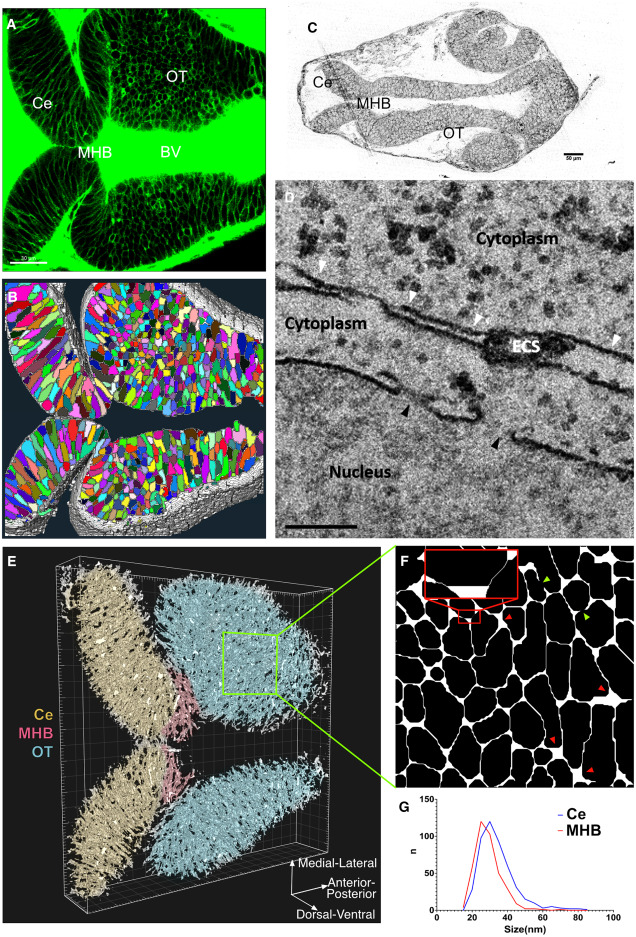
Fig. 1 The in silico architechture of zebrafish brain atlas. (A) Expression of sec-EGFP in zebrafish brain at 24 hpf (scalebar, m). (B) Segmentation of cells (color coded) and ECS (white) from 3D fluorescent image stack (materials and methods). (C) Brightfield image of thick section (thickness, 500 nm) of brain slice to provide location reference of different brain regions for following EM acquisitions (scalebar, 50 μm). (D) TEM image captured ECS from Ce region and nuclear pore as reference. White arrowheads indicate ECS, with width measurements: 31, 22, 26, and 85 nm from left to right. Black arrowheads indicate nuclear pores, and the diameters are 91 and 110 nm from left to right (scalebar, 200 nm). (E) 3D in silico representation of the brain atlas of 24-hpf zebrafish. (F) Zoomed-in slice from the OT region, showing the voids (red arrowheads) and ECS channels (red insertion) in 2D. The inset highlights two narrow ECS channels with 20 nm width separated by a void. Green arrowheads indicate dead ends. (G) Distribution of ECS widths from Ce and MHB region. The overall width of the ECS lies in the range 15–85 nm. The widths of ECSs measured were nm (mean SD) in OT and MHB and nm in Ce.