
Image
|
Figure Caption
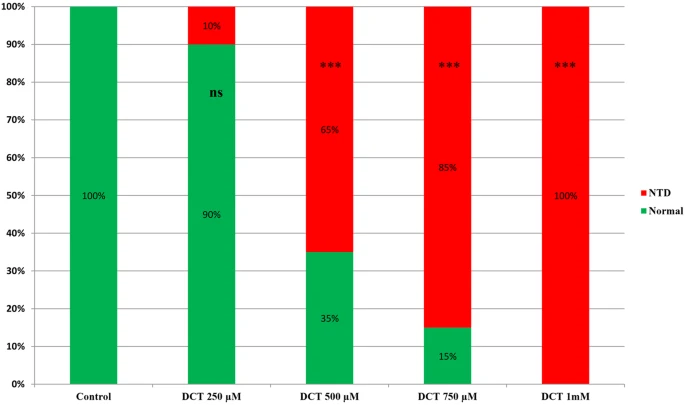
Fig. 2 The stacked column chart illustrates the percentage of developing embryos with neural tube defects at 120 hpf on exposure to different concentrations of decitabine (DCT). The percentage of phenotypic outcomes with neural tube defects in groups exposed to DCT 250 µM, 500 µM, 750 µM, and 1 mM was 10%, 65%, 85% and 100% respectively. A concentration dependent increase in percentage of phenotypic outcomes with neural tube defects was noted. Values are significantly different from control at 120 hpf. ns-non significant, ***P < 0.0001 (one-way ANOVA followed by Dunnett’s test), n=20
Acknowledgments
This image is the copyrighted work of the attributed author or publisher, and
ZFIN has permission only to display this image to its users.
Additional permissions should be obtained from the applicable author or publisher of the image.
Full text @ Neurotox Res