
|
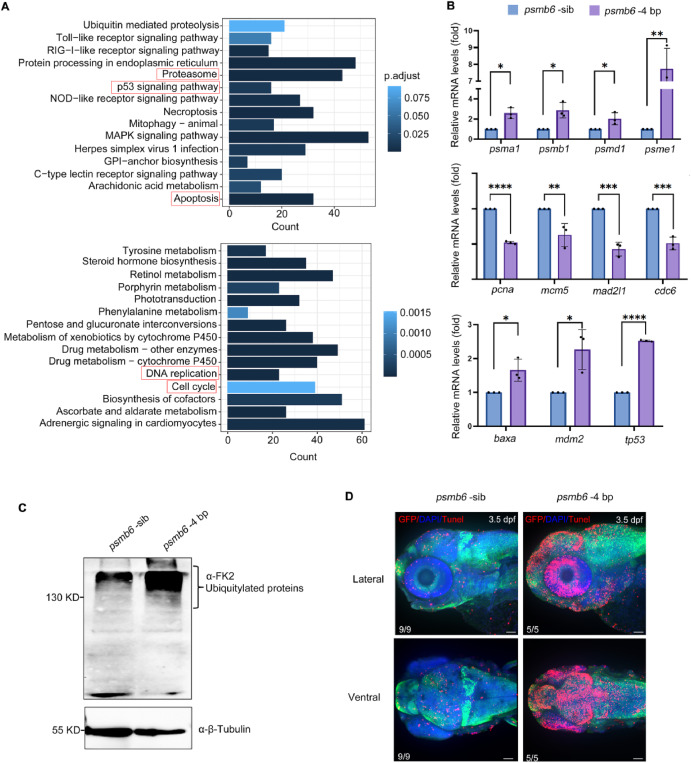
Fig. 3 Increased apoptosis of midbrain cells in psmb6 mutants. (A) The top fifteen pathways with significant differences from RNA sequencing analysis were identified. (B) Verify sequencing results by Q-PCR at 3.5 dpf.∗P < 0.05, ∗∗P < 0.01, ∗∗∗P < 0.001, ∗∗∗∗P < 0.0001, Student's t-test. (C) Detect the ubiquitinated protein by WB at 3.5 dpf, internal reference: α-β-tubulin. (D) In situ cell death detection for 3.5 dpf psmb6 mutants (red fluorescence). DAPI (blue). Scale bars: 50 μm. (For interpretation of the references to colour in this figure legend, the reader is referred to the Web version of this article.)