
Image
|
Figure Caption
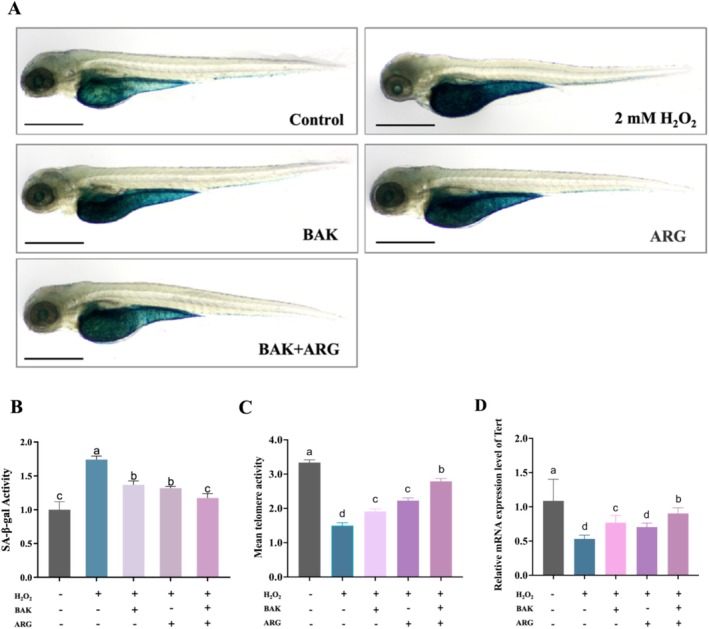
FIGURE 3
Effect of BAK and ARG on β‐galactosidase in zebrafish embryos. The scale: 200 μm. (A) β‐galactosidase staining of zebrafish embryos. (B) Viability of SA‐β‐Gal in zebrafish larvae. (C) Mean telomere activity. (D) Relative mRNA expression level of tert. Error bars represent mean ± SD for three replicates. Lowercase letters indicate significant differences:
Acknowledgments
This image is the copyrighted work of the attributed author or publisher, and
ZFIN has permission only to display this image to its users.
Additional permissions should be obtained from the applicable author or publisher of the image.
Full text @ J. Cosmet. Dermatol.