
Image
|
Figure Caption
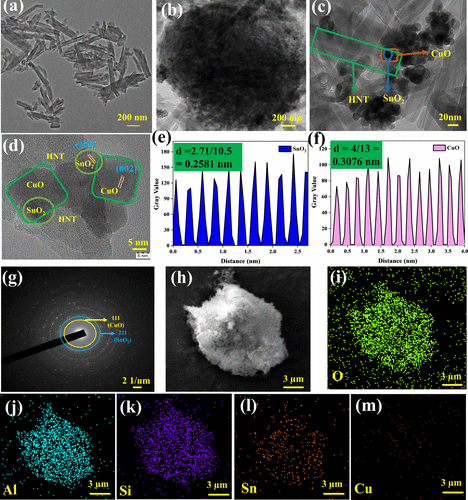
Fig. 2 Figure 2. TEM images of (a) pristine HNT, (b) the 20CS-HNT composite (at 200 nm), and (c) the 20CS-HNT composite (at 20 nm). (d) HR-TEM image of the 20CS-HNT composite (at 5 nm). d spacing values of (e) SnO2 and (f) CuO. (g) SAED pattern of the 20CS-HNT composite. Elemental mapping images of the 20CS-HNT composite: (h) overall image, (i) oxygen, (j) aluminum, (k) silicon, (l) tin, and (m) copper.
Acknowledgments
This image is the copyrighted work of the attributed author or publisher, and
ZFIN has permission only to display this image to its users.
Additional permissions should be obtained from the applicable author or publisher of the image.
Full text @ Langmuir