IMAGE

Figure 9

ID
ZDB-IMAGE-250329-74
Source
Figures for Cho et al., 2025
Image
Figure Caption

Figure 9

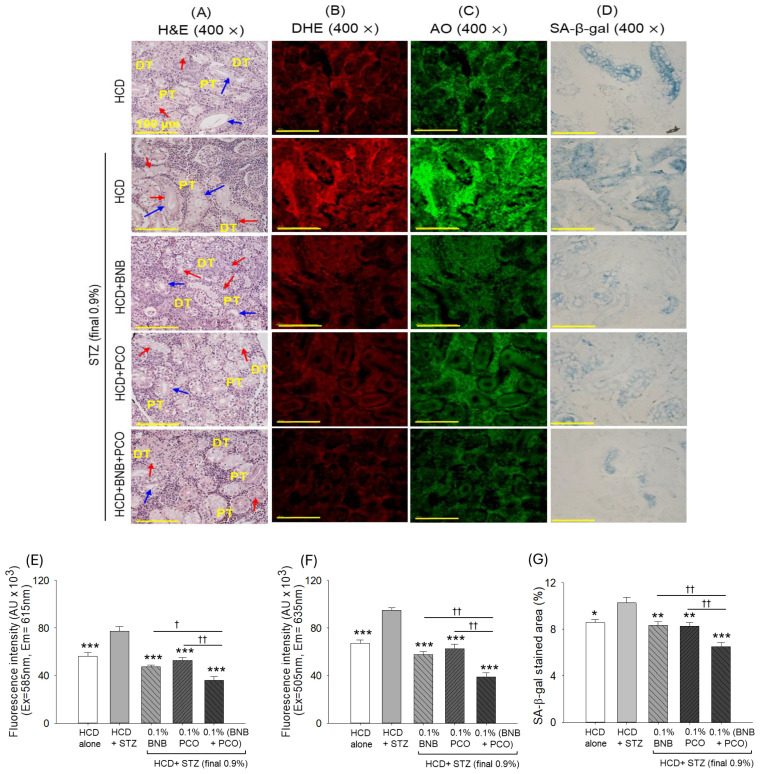
Effect of banaba leaf extract and policosanol (alone or in combination) on the kidney histology of the streptozotocin-treated hyperlipidemia zebrafish (n = 3). (A) Hematoxylin and eosin (H&E) staining. PT and DT represent the proximal and distal tubules; the blue and red arrows describe the enlarged tubular lumen and luminal debris. (B) Dihydroethidium (DHE) and (C) acridine orange (AO) fluorescent staining were used to determine ROS and apoptosis, respectively. (D) Senescence-associated β-galactosidase (SA-β-gal) staining. (E,F) illustrate the quantification of DHE and AO fluorescence intensity, respectively. (G) Percentage quantification of the SA-β-gal-positive area. Abbreviations: HCD (high cholesterol diet), STZ (streptozotocin), BNB (banaba), and PCO (policosanol). The symbols *, **, and *** underline the statistical significance at p < 0.05, p < 0.01, and p < 0.001, respectively, vs. the HCD+STZ group. † and †† indicate statistical significance at p < 0.05 and p < 0.01 vs. the BNB+PCO group.

Acknowledgments
This image is the copyrighted work of the attributed author or publisher, and ZFIN has permission only to display this image to its users. Additional permissions should be obtained from the applicable author or publisher of the image. Full text @ Pharmaceuticals (Basel)