IMAGE

Figure 7

ID
ZDB-IMAGE-250329-46
Source
Figures for Maaloul et al., 2025
Image
Figure Caption

Figure 7

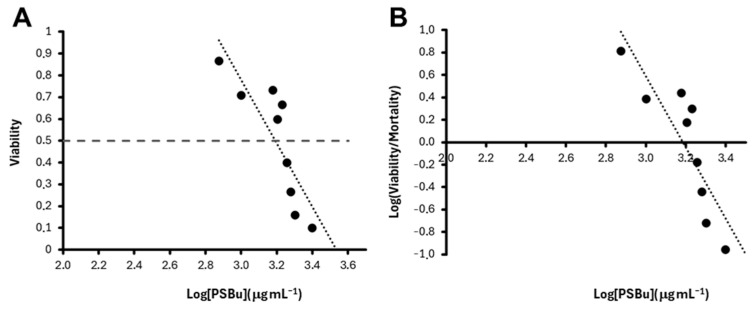
LC50 estimation following PsBu treatment of zebrafish embryos during 48 hpf. Plots show the linear relationship between viability (A) or the logarithm of the viability/mortality ratio (B) and the logarithm of concentration at 48 hpf. Intersections of regression lines with 0,5 viability index (A) and abscissa (B) are log (LC50) estimations. Linear adjustments are y = −1.591x + 5.6606 (R2 = 0.6511; p ≈ 0.0000) (A) and y = −3.1702x + 10.0968 (R2 = 0.7422; p ≈ 0.0000) (B) (Excel, Microsoft Office). LC50 values are in the text.

Acknowledgments
This image is the copyrighted work of the attributed author or publisher, and ZFIN has permission only to display this image to its users. Additional permissions should be obtained from the applicable author or publisher of the image. Full text @ Pharmaceutics