IMAGE

Figure 6

ID
ZDB-IMAGE-250325-39
Source
Figures for Ravel et al., 2025
Image
Figure Caption

Figure 6

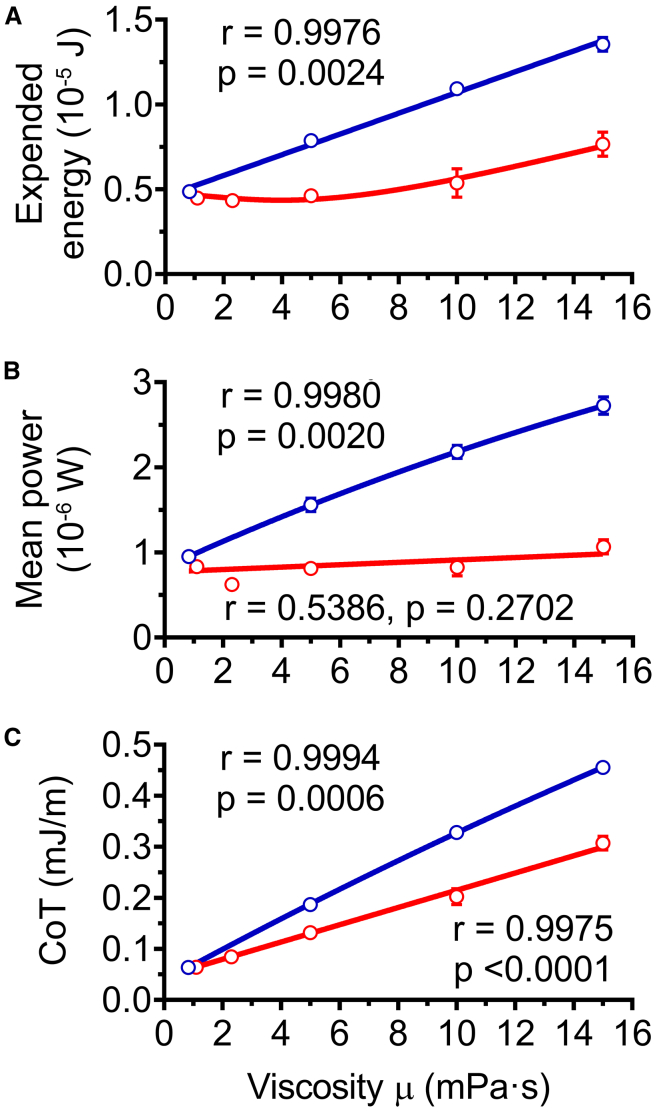
Energetic performances of zebrafish EFP-induced escape response according to increasing experimental and in silico fluid viscosities

Energetic parameters were quantified after an experimental increase of viscosity using body movements recorded in media of 0.83–15 mPa⋅s (red lines). For comparison purposes, the same parameters were assessed after computational enhancements of viscosity up to 15 mPa⋅s by using body movements recorded in water (0.83 mPa⋅s) as input data (blue lines).

(A) Total expended energy over six tail bend/beat cycles was not constrained. Experimental data-based simulations (red lines) showed no statistically significant change in total expended energy at viscosities lower than 10 mPa⋅s, and that the relation between expended energy and viscosity was not linear (p < 0.01 for 15 mPa⋅s). In the body movement simulations based upon recordings in water with virtual application of different viscosities (blue lines), a significant linear correlation existed with a regression slope significantly different from zero. Coefficients of determination R2 > 0.95 for virtual viscosity linear regressions and R2 = 0.7 for actual viscosity non-linear regression.

(B) Mean power was not statistically significantly affected by actual experimental increases in viscosity. Experimental viscosity simulations (red line) showed no significant correlation between power and viscosity, and slope was not significantly different from zero. In contrast, the slope of the virtual viscosity simulations (blue line) was significantly different from zero and the corresponding Pearson correlation test was significant. Coefficient of determination was R2 > 0.99 for the virtual viscosity linear regression.

(C) CoT was significantly affected by experimental differences in viscosity (p < 0.01 for 5 mPa⋅s, p < 0.0001 for 10 mPa⋅s and 15 mPa⋅s, respectively). CoT was linearly correlated with viscosity in experimental and virtual viscosity experiments. The slopes of both sets of simulations were significantly different from zero while Pearson’s tests showed significant correlations, but with a higher slope for in silico enhancement of viscosity (p < 0.0001). The coefficients of determination R2 were higher than 0.99 for both linear regressions. Data represented are mean ± SEM of three escape responses per experimental and virtual viscosity condition. Significance of differences in measured parameters was assessed by ANOVA followed by post-hoc Dunnett test.

Acknowledgments
This image is the copyrighted work of the attributed author or publisher, and ZFIN has permission only to display this image to its users. Additional permissions should be obtained from the applicable author or publisher of the image. Full text @ iScience