
Fig. 3 - Supplemental 2
- ID
- ZDB-IMAGE-250324-8
- Publication
- Kroll et al., 2025 - Behavioural pharmacology predicts disrupted signalling pathways and candidate therapeutics from zebrafish mutants of Alzheimer's disease risk genes
- All Figures
- Figures for Kroll et al., 2025
|
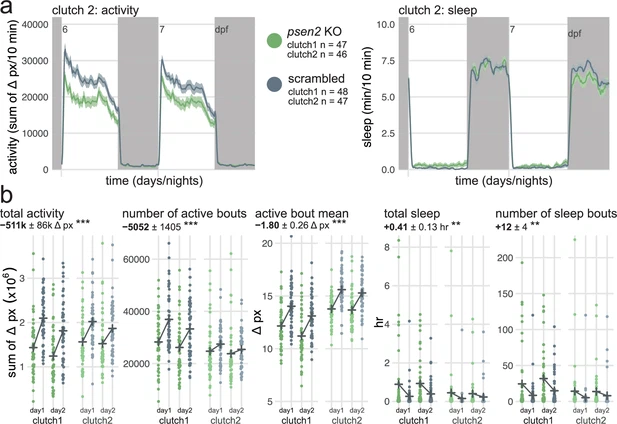
Fig. 3 - Supplemental 2 sleep/wake behaviour of psen2 F0 knockouts. (a) (left) Activity (sum of Δ pixels/10 min) of psen2 F0 knockout larvae and scrambled-injected siblings during 48 hr on a 14 hr:10 hr light:dark cycle (white background for days, dark grey background for nights). (right) Sleep (minutes per 10-min epoch) during the same experiment. Traces are mean ± SEM across larvae. This replicate experiment is called clutch 2 in Figure 3h. (b) Parameter plots for two clutches of psen2 F0 knockout larvae and scrambled-injected siblings. Each dot represents one larva during 1 day. Black crosses mark the group means. Compared to scrambled-injected siblings, psen2 F0 knockouts displaced fewer pixels (total activity, *** p<0.001) and initiated fewer swimming bouts (number of active bouts, *** p<0.001), each displacing fewer pixels in average (active bout mean, *** p<0.001). They also spent more time asleep (total sleep, ** p=0.002) and initiated more sleep bouts (number of sleep bouts, ** p=0.002) than scrambled-injected siblings. Statistics by likelihood-ratio test on linear mixed effects models.