
Fig. 2 - Supplemental 2
- ID
- ZDB-IMAGE-250324-5
- Publication
- Kroll et al., 2025 - Behavioural pharmacology predicts disrupted signalling pathways and candidate therapeutics from zebrafish mutants of Alzheimer's disease risk genes
- All Figures
- Figures for Kroll et al., 2025
|
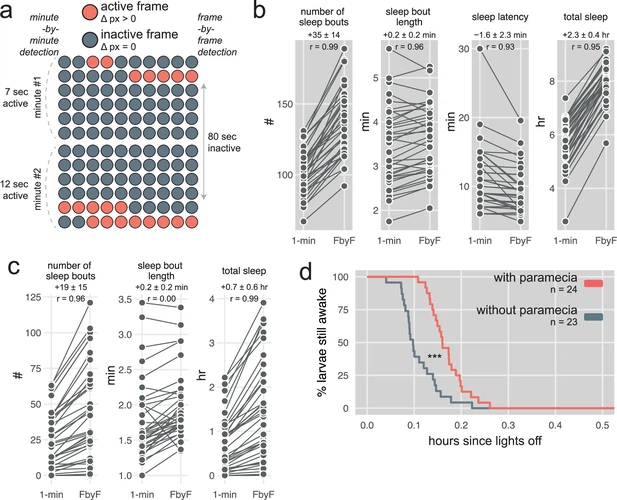
Fig. 2 - Supplemental 2 Sleep detection by the FramebyFrame R package. (a) Example of a sleep bout detected by the FramebyFrame R package that is missed by analysis done on 1-min epochs. In this example, the larva was inactive for 80 consecutive seconds, which represents a sleep bout as per the 1-min inactivity criterion for sleep (Rihel et al., 2010b). Binning in 1-min epochs misses the sleep bout as it returns two active minutes with 7 and 12 s of activity per minute, while the FramebyFrame package detects the 80 s sleep bout. (b) Difference in sleep parameters measurements between the 1-min analysis and the frame-by-frame analysis performed on the same dataset. One line represents one wild-type larva during one night. 1-min, results obtained with the minute-by-minute detection; FbyF, results obtained with the FramebyFrame R package; r, Pearson correlation. (c) Difference in sleep parameters measurements between the 1-min analysis and the frame-by-frame analysis, as in (b). One line represents one wild-type larva during one day. (d) Example of a sleep latency survival plot generated with the FramebyFrame R package. Starting at lights-off, larvae that experienced their first sleep bout were gradually removed from the survival curve. At any timepoint, the larvae with paramecia in the well were 68 ± 31% less likely to fall asleep for the first time than larvae housed without paramecia: hazard ratio for larvae with paramecia = 0.32 ± 0.31, *** p<0.001 by likelihood-ratio test.