
Fig. 6
- ID
- ZDB-IMAGE-250324-19
- Publication
- Kroll et al., 2025 - Behavioural pharmacology predicts disrupted signalling pathways and candidate therapeutics from zebrafish mutants of Alzheimer's disease risk genes
- All Figures
- Figures for Kroll et al., 2025
|
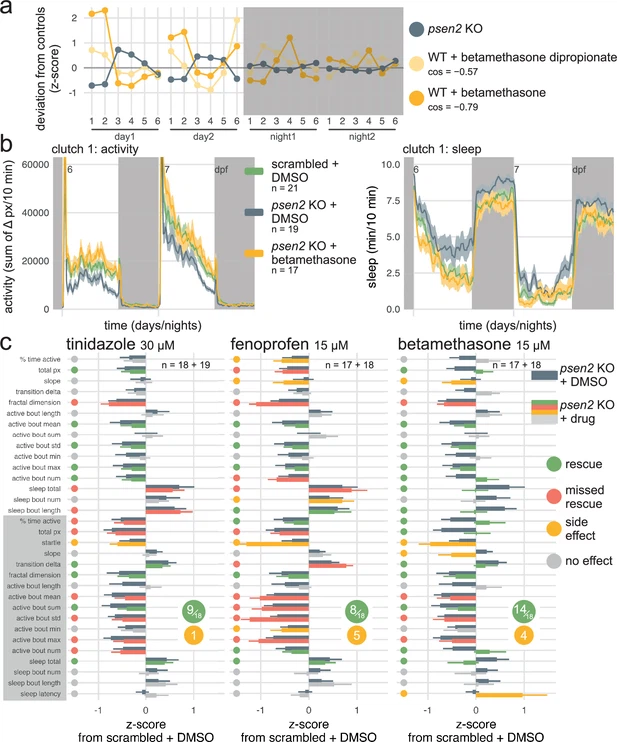
Fig. 6 Betamethasone normalises the psen2 knockout behavioural phenotype. (a) The psen2 F0 knockout fingerprint was used as query to identify small molecules that generate the opposite behavioural phenotype when applied on wild-type larvae, returning betamethasone as candidate therapeutic. Plotted are the query psen2 fingerprint (mean of two clutches, dark grey) and the two betamethasone fingerprints from the drug database with the largest negative cosine similarities (yellow). Parameters: 1, average activity (sec active/min); 2, average waking activity (sec active/min, excluding inactive minutes); 3, total sleep (hr); 4, number of sleep bouts; 5, sleep bout length (min); 6, sleep latency (min until first sleep bout). cos, cosine similarity between each betamethasone fingerprint and the psen2 F0 knockout fingerprint. (b) (left) Activity (sum of Δ pixels/10 min) of scrambled-injected larvae treated with DMSO and psen2 F0 knockout larvae treated with DMSO or 15 µM betamethasone during 48 hr on a 14 hr:10 hr light:dark cycle (white background for days, dark grey background for nights). (right) Sleep (minutes per 10 min epoch) during the same experiment. Traces are mean ± SEM across larvae. See also Figure 6—figure supplement 1 for results from replicate clutch 2. (c) Survey of behavioural parameters for each drug treatment. Bars represent the mean deviation from scrambled-injected siblings treated with DMSO (z-score, mean ± SEM). Dark grey bars represent the psen2 knockouts treated with DMSO, i.e. the phenotype to be treated (same population of psen2 knockouts treated with DMSO for all the drug treatments, n=19+18). Other bars are colour-coded by the effect of each drug on psen2 knockouts: ‘rescue’ (green) if the drug normalised the parameter; ‘missed rescue’ (red) if the drug failed to normalise the parameter; ‘side effect’ (yellow) if the drug significantly altered a parameter which was unaffected in psen2 knockouts; and ‘no effect’ (grey). Calls were decided based on significance by likelihood-ratio test on linear mixed effects models calculated on the raw parameter values from both clutches (n is sample size of drug-treated psen2 knockouts of clutch1 + clutch2).