
FIGURE 8
- ID
- ZDB-IMAGE-250322-8
- Publication
- Le et al., 2025 - A zebrafish model of crim1 loss of function has small and misshapen lenses with dysregulated clic4 and fgf1b expression
- All Figures
- Figures for Le et al., 2025
|
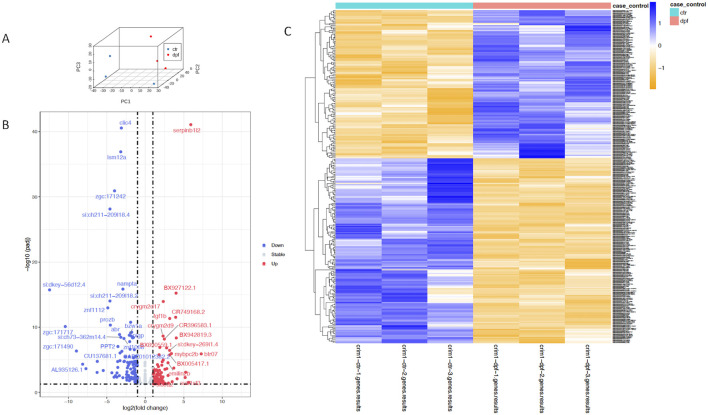
FIGURE 8
Principal component analysis, heatmap, and volcano plot showing DEGs for controls and