
Image
|
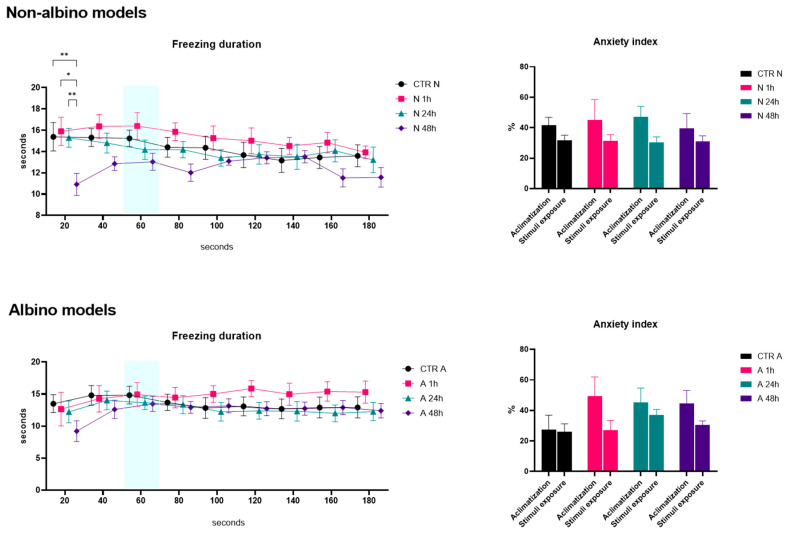
Figure Caption
Figure 2
Graphical representation of the freezing duration (seconds) and anxiety index (%) results for both albino (A) and non-albino (N) zebrafish models in the predator video stimuli test. “1 h/24 h/48 h” represents the exposure time to oxytocin. The blue mark represents the moment when the stimulus appeared during the test. The data are expressed as the mean ± SEM, and a
Acknowledgments
This image is the copyrighted work of the attributed author or publisher, and
ZFIN has permission only to display this image to its users.
Additional permissions should be obtained from the applicable author or publisher of the image.
Full text @ Int. J. Mol. Sci.