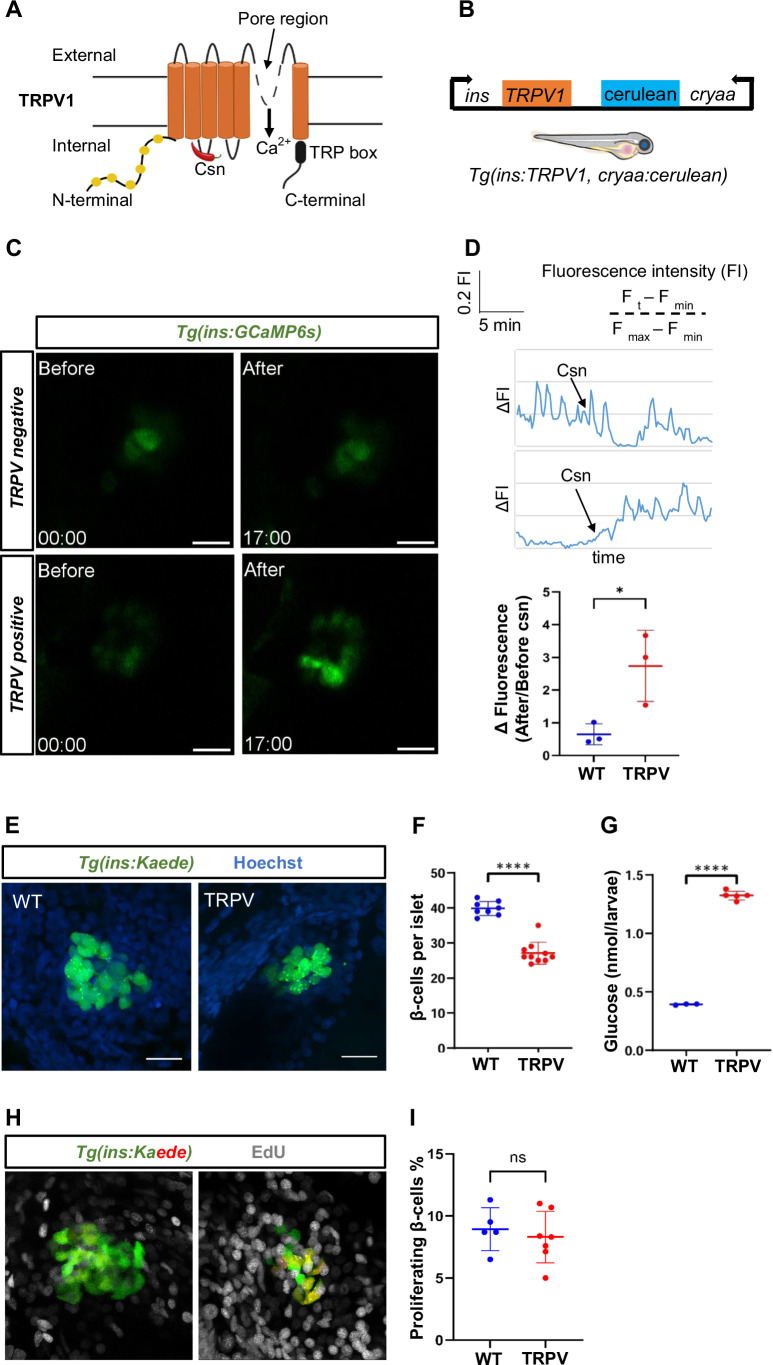
Figure 4
Generation of a genetic model of beta-cell excitotoxicity in zebrafish.
(A) Structural representation of the transient receptor potential channel vanilloid channel (TRPV) and its mechanism of activation by the small molecule, capsaicin. (B) Schematic representation of the genetic construct used to generate the transgenic model of beta-cell Ca2+ excitotoxicity in zebrafish. The rat TRPV was cloned under the zebrafish insulin promoter. Cerulean expression under the control of the crystalline (cryaa) promoter serves as a marker of transgenic animals (blue eyes). (C) Representative snapshots from live imaging of larvae expressing GCaMP6s in the beta cells. The images depict beta-cell GCaMP6s fluorescence before and after capsaicin (csn) stimulation of control and TRPV-expressing beta cells. Scale bar, 20 µm. n = 3 independent samples per group. The time-stamp indicates minutes. (D) Traces and quantification of GCaMP6s fluorescence intensity over time for the islets shown in C. While the control larvae showed no perturbation in calcium dynamics, there was a sustained increase in calcium levels of the beta cells from Tg(ins:TRPV) larvae post csn-stimulation. The dot-plot graph shows the relative change in GCaMP6s fluorescence intensity after csn-stimulation in 5 dpf WT and TRPV larvae. Error bars are mean ± SD from n = 3 independent samples per group. Two-tailed t-test, *p = 0.0331. (E) Confocal images (maximum projection) of islets from Tg(ins:Kaede) and Tg(ins:TRPV);Tg(ins:Kaede) larvae following incubation with csn from 3 to 5 dpf. Tg(ins:kaede) marks the beta cells (green) while the nuclei are stained with Hoechst (blue). Scale bar 20 µm. (F) Quantifications of the number of beta cells per islet in control and Tg(ins:TRPV) larvae. Error bars are mean ± S D from n = at least 7 independent samples per group. The horizontal bar represents the mean value. Unpaired two-tailed t-test with Welch’s correction, ****p = 0.0000000219. (G) Plot showing average glucose value in WT and Tg(ins:TRPV) larvae following csn treatment for 48 h. Each dot corresponds to a pool of 10 larvae. Error bars are mean ± SD from n = at least 3 independent replicates per group. Unpaired two-tailed t-test with Welch’s correction, ****p = 0.000000351. (H) EdU-stained representative confocal images (maximum projection) of islets from Tg(ins:Kaede) and Tg(ins:TRPV);Tg(ins:Kaede) after photoconversion and treatment with csn from 3 to 5 dpf. The newly formed beta cells are marked with green; the pre-existing beta cells are in red/yellow, and EdU-positive cells are marked in gray. Scale bar 20 µm. (I) Quantification showing the percentage of proliferating (red/yellow) beta cells during csn treatment in both control and Tg(ins:TRPV). The horizontal bar represents the mean value. Error bars are mean ± SD from n = at least 5 independent samples per group. Unpaired two-tailed t-test with Welch’s correction, ns not significant (0.359). Source data are available online for this figure.
Acknowledgments
This image is the copyrighted work of the attributed author or publisher, and
ZFIN has permission only to display this image to its users.
Additional permissions should be obtained from the applicable author or publisher of the image.
Full text @ EMBO J.
Your Input Welcome
Thank you for submitting comments. Your input has been emailed to ZFIN curators who may contact you if
additional information is required.
Oops. Something went wrong. Please try again later.