
|
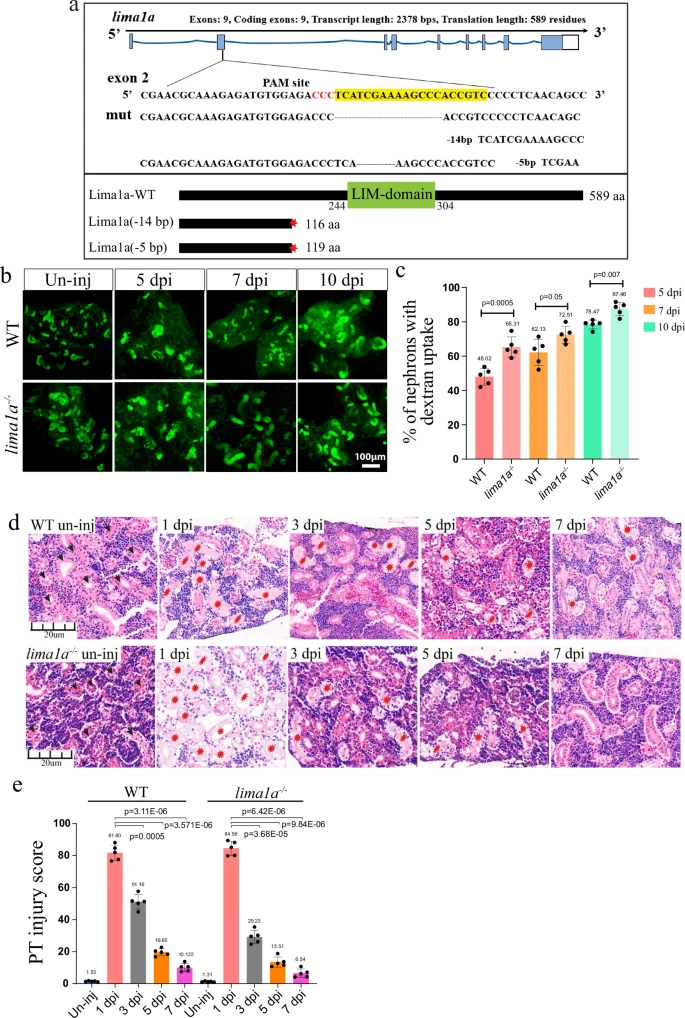
Fig. 7 lima1a loss accelerates nephron regeneration.a CRISPR/cas9 design and the resulting in mutant alleles for lima1a. Upper: the design of CRIPSR/Cas9 and DNA sequencing results; lower: cartoon showing the full-length and respective truncated proteins. b Representative dextran fluorescent signals of kidneys at the indicated time points, in control and lima1a−/− animals. un-inj: uninjured. Green signals: dextran labeled PT. The experiments were repeated three times, and shown were representative images. c Quantification of panel b (n = 3–5 different regions of interest per group), showing the percentage of fluorescent nephrons. d HE staining images of kidneys at the indicated time points, in control and lima1a−/− animals. Black arrow heads: normal tubules, and red stars: damaged tubules. un-inj: uninjured. e Quantification of panel d (n = 4–5 different regions of interest per group), to show the renal recovery dynamics after AKI. The PT injury score is used to show the percentage of abnormal PTs. HE staining experiments were repeated three times, and shown were representative images. p-values for each panel were indicated to show the statistical significance.