
|
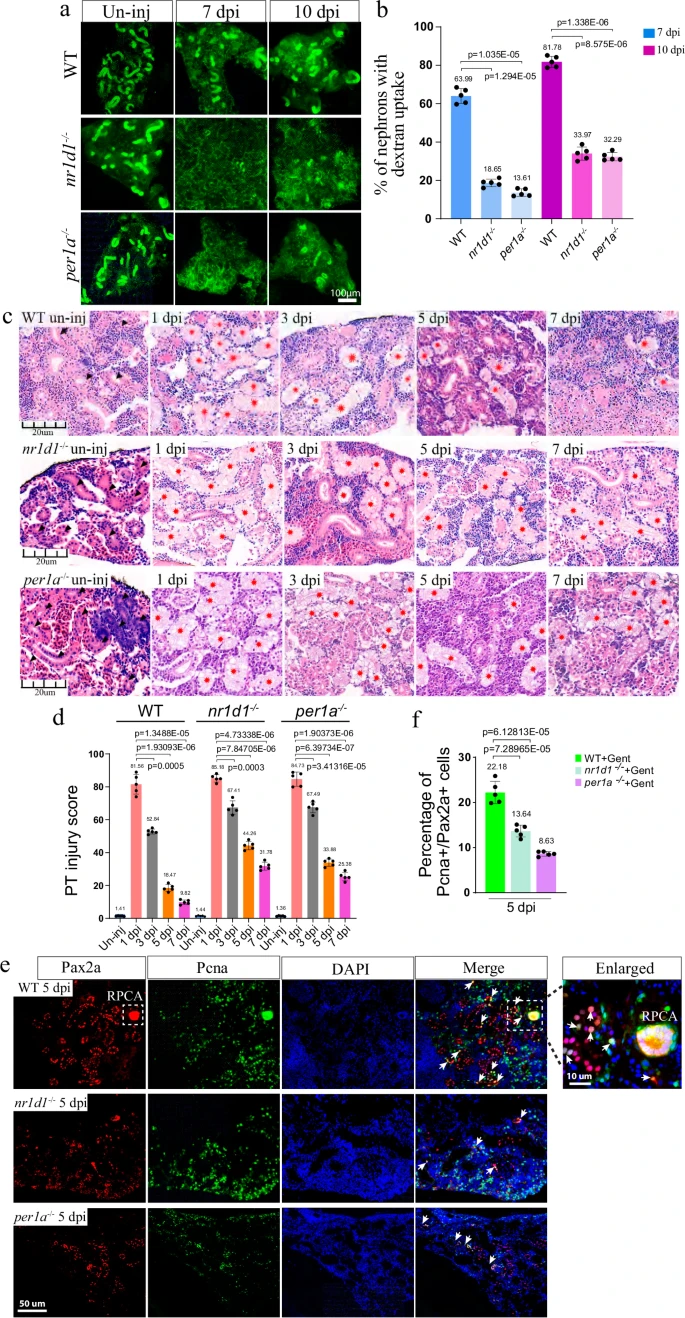
Fig. 5 Loss of per1a and nr1d1 leads to renal regeneration defects.a Representative dextran fluorescent signals of kidneys at the indicated time points, in control, per1a−/−, and nr1d1−/− zebrafish. The ability to uptake dextran was used to indicate the regenerated nephrons. b Quantification of panel a (n = 3–5 different regions of each group), showing the percentage of fluorescent nephrons. c HE staining results of kidneys at the indicated time points, in control, per1a−/−, and nr1d1−/− animals. Black arrow heads: normal tubules, and red stars: damaged tubules. d Quantification of panel c (n = 4–5 different regions of each group), to show the renal recovery dynamics after AKI. The PT injury score is used to show the percentage of abnormal PTs. e Pax2a and Pcna double-staining images of kidneys from control, per1a−/−, and nr1d1−/− animals at 5 dpi. White arrows: Pax2a and Pcna double positive single cells. White box with the dashed line: Pax2a expressing RPC aggregates, which were zoomed in on the right corner. f Quantification of panel e (n = 4–5 different regions of each group), with p-values. Gent: gentamicin. The IF and HE were repeated three times, and shown were representative data. p-values for each panel were indicated to show the statistical significance.