
|
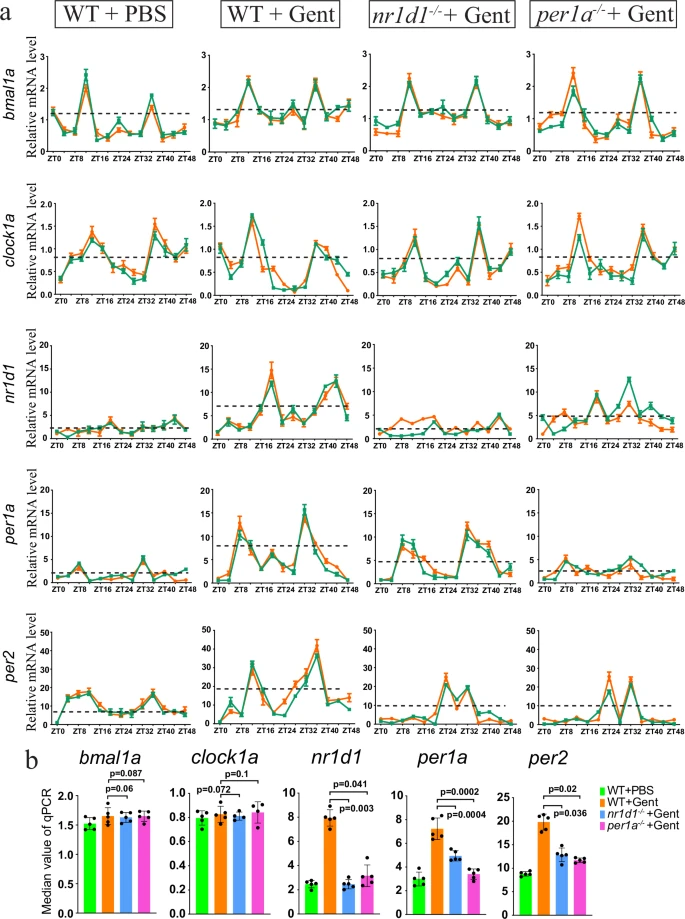
Fig. 4 Rhythmic expression of the circadian clock genes.a qRT-PCR results showing the rhythmic expression of the indicated clock genes at 8 h time points over 48 h, with and without gentamicin (Gent) treatment. The green and red colors were used to represent the average values of two replicates (each with three biological repeats). The dashed black lines indicated the median values of mRNA levels. qRT-PCR was repeated at least four times, and shown were two replicates. b Quantification of panel a, based on the median values of mRNA levels. P-values for each panel were indicated to show the statistical significance.