
|
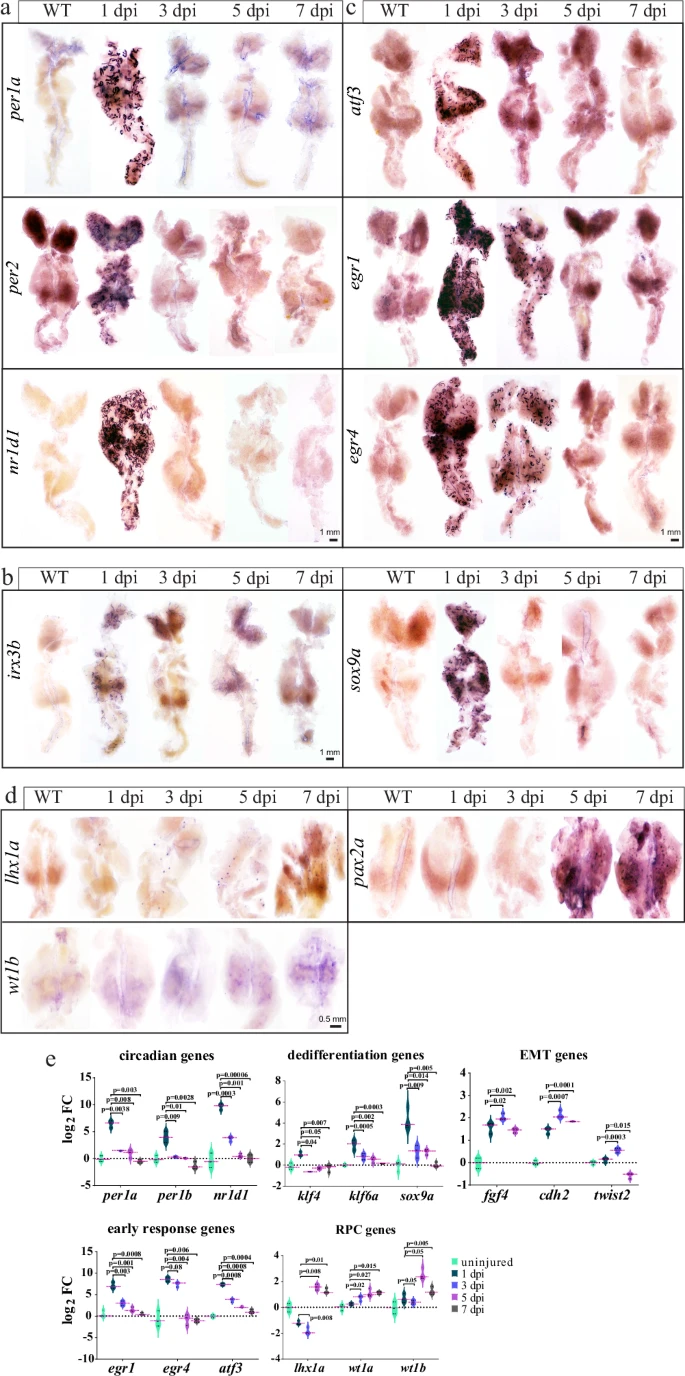
Fig. 3 Validation of the dynamic expression of the indicated genes.a WISH image of the indicated circadian clock genes. b WISH images of the indicated dedifferentiation genes. c WISH images of the indicated early response genes. d WISH images of the RPC genes. e Plots showing the dynamic expression of the indicated genes during a time course of 7 days after AKI, based on 3 bulk RNA-seq replicates. Log2 FC: the log2 fold change of the indicated gene’s expression at the indicated time points relative to day 0 (uninjured kidneys). P-values were indicated to show statistical significance. WISH experiments were repeated three times, and shown were representative data.