
|
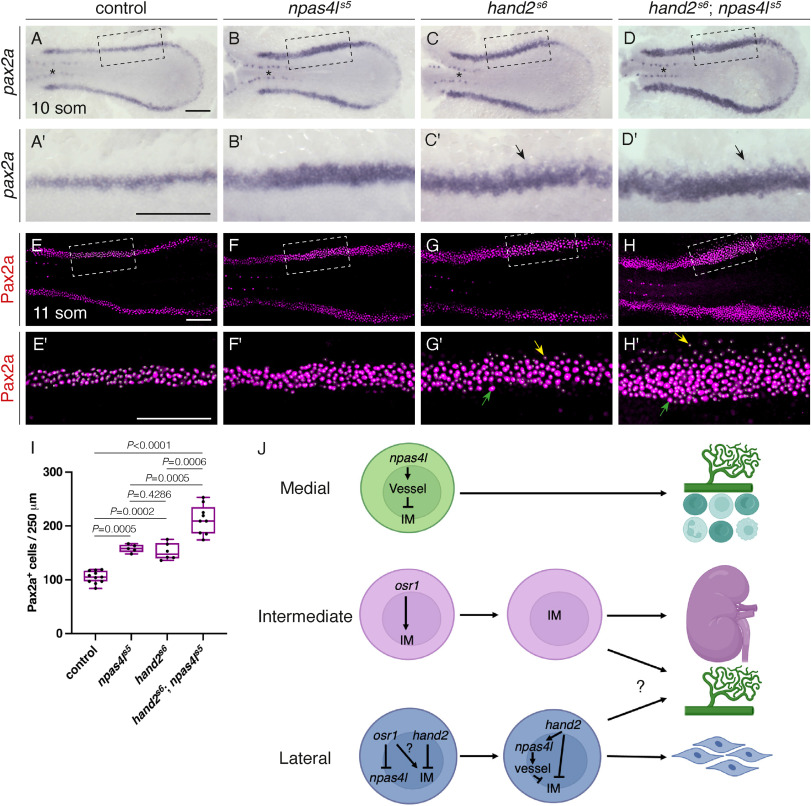
Fig. 8 IM defects in npas4ls5mutants are enhanced by loss of hand2 function. (A–H) Dorsal views, anterior to the left, of the posterior mesoderm. (A–D) In situ hybridization shows expression of pax2a in the IM (arrows) at 10 som. Compared with wild-type (A), expression is widened in npas4ls5 mutants (B) and hand2s6 mutants (C) and widened further in hand2s6;npas4ls5 double mutants (D). Expression in the overlying spinal neurons (asterisk) is unaffected. Unlike the width of the IM, we did not observe a noticeable change in the proximal-distal length of the IM in mutant embryos. (A′-D′) Magnification of boxed regions in (A–D). Faint lateral staining (arrows) was frequently observed in hand2s6 mutant (C′) and hand2s6;npas4ls5 double mutant (D′) embryos. n = 60 (A), 17 (B), 21 (C), 7 (D). (E–H) Three-dimensional reconstructions of Pax2a immunofluorescence in the IM of wild-type (E), npas4ls5 mutant (F), hand2s6 mutant (G) and hand2s6;npas4ls5 double mutant (H) embryos at 11 som. (E′-H′) Magnification of boxed 250 μm long regions used for counting Pax2a+ cells. White dots indicate Pax2a+ nuclei. In hand2s6 mutant and hand2s6;npas4ls5 double mutant embryos, intensity of Pax2a+ staining varied from strong (for example, green arrows) to weak (for example, yellow arrows). As seen with in situ hybridization, the fainter Pax2a+ levels were typically observed at the lateral edge in hand2s6 mutants (G′) and hand2s6;npas4ls5 double mutants (H′). n = 11 (E), 5 (F), 6 (G), 9 (H). Scale bars: 100 μm. (I) Quantification of the numbers of Pax2a + cells per 250 μm of IM in the indicated genotypes demonstrates an increase in IM cells in hand2s6; npas4ls5 double mutant embryos exceeding that seen in either single mutant. Boxes represent interquartile range, central line marks the median, and whiskers indicate maximum and minimum values. P values were calculated using non-parametric Mann–Whitney U-tests. (J) Model of organ field formation in the lateral posterior mesoderm in zebrafish. In the most medial territory, npas4l promotes expression of vessel progenitor genes (labeled “vessel”; including etv2, lmo2, and tal1), which inhibit IM. Expression of the kidney progenitor-associated gene pax2a can initially be detected in this region (Fig. 1, S1; not depicted in model), highlighting the importance of inhibiting further IM-associated gene expression. The medial aspect of this territory also gives rise to hematopoietic progenitors. The intermediate territory expresses IM-associated genes (including lhx1a and pax2a); osr1 is initially expressed in this territory (Fig. 1, S1) and is required for forming the full complement of IM (Perens et al., 2021). Initially, the most lateral territory expresses both osr1 and hand2 (Perens et al., 2016). Whether osr1 also promotes formation of some kidney progenitors in this territory remains unknown. Later, as osr1 expression decreases (as shown in (Perens et al., 2021)), hand2 expression promotes npas41 expression, which inhibits further IM gene expression and results in the generation of the LVPs. The precise origin of the LVPs remains unclear as they can express markers of both the intermediate (pax2a) and lateral (hand2) territories (Fig. 2). The remainder of the lateral territory continues to express hand2 and gives rise to other lateral plate mesoderm derivatives, including the mesothelium (Prummel et al., 2022).
Reprinted from Developmental Biology, 517, Perens, E.A., Yelon, D., Drivers of Vessel Progenitor Fate Define Intermediate Mesoderm Dimensions by Inhibiting Kidney Progenitor Specification, 126-139, Copyright (2024) with permission from Elsevier. Full text @ Dev. Biol.