
|
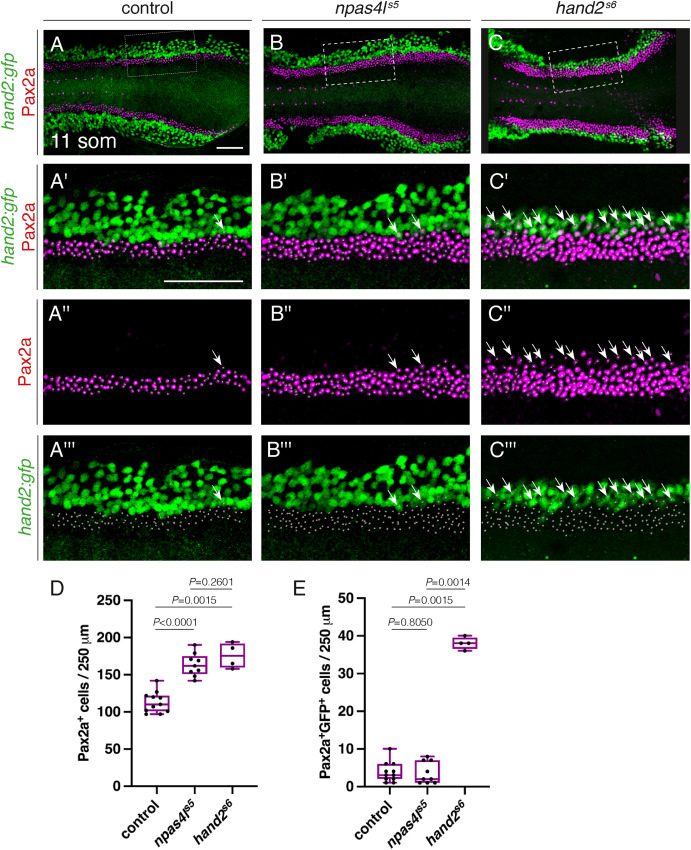
Fig. 7 npas4l inhibits IM formation. Immunofluorescence for Pax2a and GFP in wild-type (A), npas4ls5 mutant (B), and hand2s6 mutant (C) embryos carrying Tg (hand2:EGFP); dorsal views, anterior to the left, of three-dimensional reconstructions at 11 som. (A′-C‴) Magnification of regions from (A–C) used for quantification of the numbers of Pax2a+ cells. 250 μm stretches of the IM were analyzed per embryo. The length of the analyzed region varies within the boxed region due to mild curvature of the embryo in the z-axis. White dots indicate Pax2a+ nuclei and arrows indicate examples of Pax2a+GFP+ cells. Scale bars: 100 μm. (D,E) Quantification of the numbers of Pax2a+ cells (D) and Pax2a+GFP+ cells (E) per 250 μm of IM in wild-type control, npas4ls5, and hand2s6 embryos demonstrates an increase in IM cells in npas4ls5and hand2s6 embryos, but an increase in Pax2a+GFP+ cells only in hand2s6 embryos. Boxes represent interquartile range, central line marks the median, and whiskers indicate maximum and minimum values. P values were calculated using non-parametric Mann–Whitney U-tests. n = 11 (A), 9 (B), 4 (C).
Reprinted from Developmental Biology, 517, Perens, E.A., Yelon, D., Drivers of Vessel Progenitor Fate Define Intermediate Mesoderm Dimensions by Inhibiting Kidney Progenitor Specification, 126-139, Copyright (2024) with permission from Elsevier. Full text @ Dev. Biol.