
Fig. 3.
- ID
- ZDB-IMAGE-250109-178
- Publication
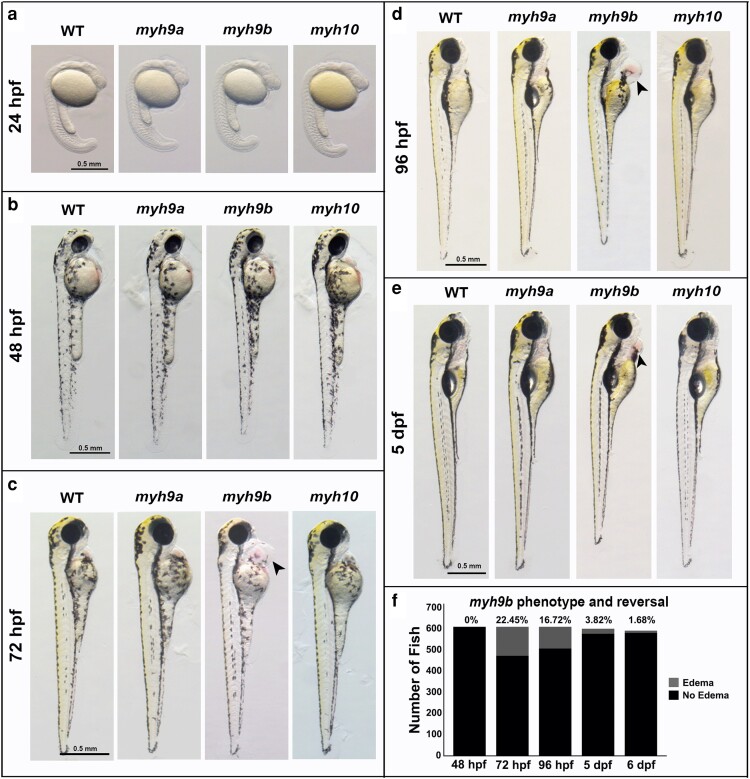
- Rolfs et al., 2024 - myh9b is a critical non-muscle myosin II encoding gene that interacts with myh9a and myh10 during zebrafish development in both compensatory and redundant pathways
- All Figures
- Figures for Rolfs et al., 2024
|
Fig. 3.